
Can I export the data?
There are multiple options for exporting the data to a CSV file including full demographic splits, hourly and weekday trends, and granularity ranging from 15...
For a daily breakdown, the Key Metrics view provides multiple options for demographic splits, whilst the Explorer view is the choice for 15-minute and hourly granularity in addition to trend analysis. A summary of export options, and an example of how to export, is included below.
Key Metrics: Ideal for a daily breakdown — includes multiple options for demographic splits
Export Visible data
A summary of the total volumes for the selected date period
Export Visible data by day: split by role
A daily breakdown, split by staff and customer
Export Visible data by day: split by gender
A daily breakdown, split into male and female
Export Visible data by day: split by age
A daily breakdown, split into the seven age group categories
Export Visible data by day: split by age and gender
A comprehensive export including a daily breakdown by age and gender
Export Visible data by day: no split (excluding staff)
A daily breakdown with no demographic splits — staff are removed by default.
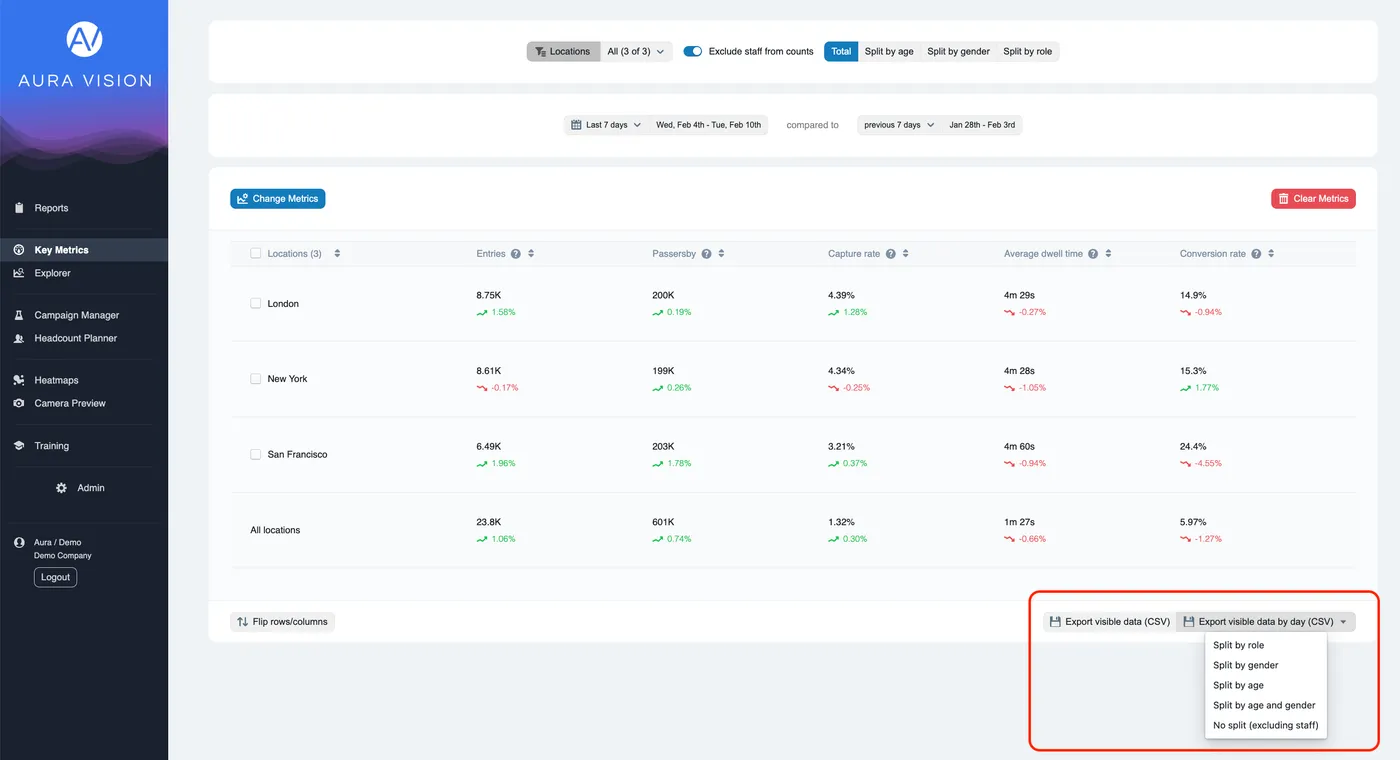
You can access these options at the bottom right of the Key Metrics view as shown in this image:
Explorer: Ideal for 15-minute and hourly granularity, and trend analysis
Quarter hourly
Ideal for reviewing peak trade periods. A 15-minute breakdown
Hourly
Ideal for reviewing peak trade periods. An hourly breakdown
Daily
A daily breakdown
Weekly (Mon – Sun)
A weekly breakdown for organisations that require a Monday to Sunday view
Weekly (Sun – Sat)
A weekly breakdown for organisations that require a Sunday to Saturday view
Monthly
A monthly breakdown
Day of Week
Ideal for identifying daily trends. Works best when selecting 2 or more weeks
Hour of Day
Ideal for identifying hourly trends. Works best when selecting 2 or more weeks
Day of Week and Hour of Day
Ideal for identifying hourly trends across each trading day. Works best when selecting 2 or more weeks
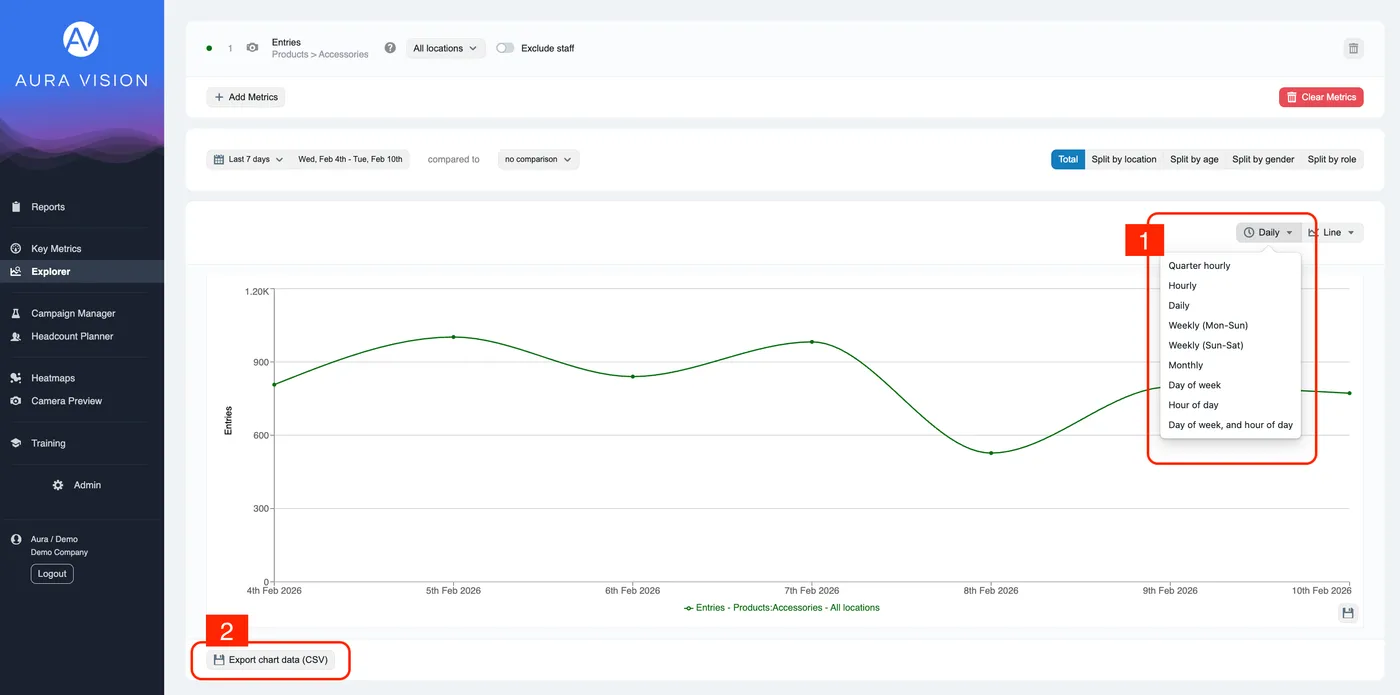
In the Explorer view you select an option using the breakdown picker — located to the right of the graph (1).
Apply your date range, store selection and demographic filters as required, then click on the ‘export chart data’ button (2):