# Aura Vision — Full Site Content for LLMs
> AI-powered retail analytics from your existing security cameras. No new sensors. No personal data. Just answers.
## Company Overview
Aura Vision is a computer vision and AI company that transforms existing in-store CCTV cameras into an anonymous analytics platform for physical retail. The platform provides footfall counting, demographic estimation, customer journey mapping, zone analytics, and an AI-powered natural language interface called "Ask Aura."
- **Founded:** 2017
- **Founders:** Daniel and Jaime — PhDs in Computer Vision and Machine Learning, University of Southampton
- **Headquarters:** 81 Rivington Street, London EC2A 3AY, United Kingdom
- **Accelerator:** Y Combinator (W19)
- **Website:** https://auravision.ai
- **LinkedIn:** https://www.linkedin.com/company/auravisionlabs
## How It Works
1. A small plug-and-play APU (Analytics Processing Unit) connects to a store's existing camera network
2. All video is processed on-device using computer vision and deep learning
3. Video is immediately discarded — only anonymous, aggregated analytics reach the cloud
4. Retailers access insights via a dashboard or the "Ask Aura" natural language interface
No new cameras or sensors are required. No personal data is collected or stored.
## Key Capabilities
- **Footfall counting** — accurate customer counts across all store entrances and zones
- **Demographic estimation** — anonymous age and gender segmentation (no biometric identification)
- **Customer journey mapping** — pathmaps and heatmaps showing how shoppers navigate stores
- **Staff vs. customer separation** — distinguish employees from shoppers for accurate metrics
- **Zone analytics** — dwell time, engagement, and conversion by store area
- **Queue analytics** — service-desk utilisation, wait times, and basket recovery
- **Campaign & layout A/B testing** — measure the impact of display changes, refits, and promotions
- **Ask Aura** — AI-powered natural language interface for instant retail insights
## API
The Aura Vision API gives programmatic access to the same visitor analytics that power Aura Vision dashboards — footfall, dwell time, occupancy, area utilisation, demographic breakdowns, transaction conversion, and live device status. Use it to build into a BI tool, sync to a data warehouse, automate retail operations, or pull metrics into a customer-facing app.
- **Core REST API** — `https://api.auravisionlabs.com/v1` — resources and campaigns: locations, recordings, uptime, status
- **Metrics WebSocket API** — `wss://ws.auravision.ai` — all analytics over a single streaming connection: footfall, dwell, occupancy, sales, heatmaps, exports
- **Documentation:** https://auravision.ai/api
- **Authentication:** Bearer token (see https://auravision.ai/api/authentication)
### Core REST endpoints
#### Status
- `GET /status` — Service status: Public health check — no authentication required.
#### Users
- `GET /users/profile` — Get user profile: Fetch the authenticated user's profile and discover your organisation ID.
#### General
- `GET /organisation/:id` — Get organisation: Fetch the details of an organisation by ID.
- `GET /organisation/:id/availableMetrics` — Get available metrics: Discover which metrics are enabled on your organisation, grouped by domain.
#### Locations
- `GET /location/list` — List locations: List physical sites you have access to.
- `GET /location/:id` — Get location: Fetch a single location by ID.
#### Recordings
- `GET /recording/list` — List recordings: List camera feeds across your organisations and locations.
- `GET /recording/:id` — Get recording: Fetch a single recording (camera feed) by ID.
- `GET /recording/:id/uptime` — Get recording uptime: Historic uptime for a single recording over a date range.
- `POST /recording/uptimes` — Bulk recording uptime: Uptime for many recordings in a single request.
#### Campaigns
- `GET /campaign` — List campaigns: List measurement campaigns on your organisation.
- `GET /campaign/:id` — Get campaign: Fetch a single campaign by ID.
- `POST /campaign` — Create campaign: Create a campaign with test and control periods.
- `PUT /campaign/:id` — Update campaign: Replace a campaign's configuration.
- `DELETE /campaign/:id` — Delete campaign: Delete a campaign by ID.
### Metrics WebSocket endpoints
#### General
- `WS detail/list (organisation, location, recording, camera_server)` — Reference data: Reference data for organisations, locations, recordings, and camera servers — over the Metrics WebSocket.
#### Traffic
- `WS metric/entries` — Entries: Location entrants — people who entered the location through its main entrance.
- `WS metric/passers-by` — Passers-by: People who passed the location without entering.
- `WS metric/capture-rate` — Capture rate: Entry rate as a proportion of passing traffic.
#### Occupancy & Dwell
- `WS metric/average-dwell-time` — Average dwell time: Average dwell time across the whole location — how long visitors spend on average.
- `WS metric/average-occupancy` — Average occupancy: Average number of people in the location over the period.
- `WS metric/max-occupancy` — Max occupancy: Peak observed occupancy across the whole location.
#### Lines
- `WS detail/list (line_context)` — Line taxonomy: Configuration metadata for the lines defined on your locations — enumerate available lines before querying.
- `WS metric/internal/line-entries` — Line entries: Entries through a named line inside a location (e.g. into a department, fitting rooms, or service area).
- `WS metric/internal/line-passers-by` — Line passers-by: Pass-bys at a named line — people who walked past a zone boundary without crossing into it.
- `WS metric/internal/capture-rate` — Line capture rate: Capture rate at a named zone — entries to the zone as a proportion of zone pass-bys.
- `WS metric/internal/line-crossings-per-location-entrant` — Line entries per visitor: Line entries divided by location entrants — average entries per visitor across a named line.
- `WS metric/internal/line-crossings` — Location movement: Within-location movement crossings at named lines (directional traffic between zones).
#### Areas
- `WS detail/list (area_context)` — Area taxonomy: Configuration metadata for the areas defined on your locations — enumerate available zones before querying.
- `WS metric/area/data` — Area entries: Total entries to a defined area or zone — fitting rooms, service zones, product areas.
- `WS metric/area/data` — Area total dwell: Total dwell time accumulated inside a defined area or zone over the period.
- `WS metric/area/data` — Area average dwell: Mean dwell time per area entry — how long each visit to the zone lasts on average.
- `WS metric/area/average-occupancy` — Average area occupancy: Average occupancy of a defined area over the period.
- `WS metric/area/max-occupancy` — Max area occupancy: Peak observed occupancy in a defined area.
- `WS metric/area/utilisation` — Area utilisation: Percentage of time an area was occupied during the period.
- `WS metric/area/dwell-per-location-entrant` — Area dwell per visitor: Total area dwell time divided by location entrants — average time each visitor spends in this zone.
- `WS metric/area/entries-per-location-entrant` — Area entries per visitor: Area entries divided by location entrants — how often each visitor steps into this zone.
#### Sales
- `WS metric/transactions/data` — Transactions: Count of completed transactions over the period.
- `WS metric/transactions/data` — Volume: Total monetary value of transactions over the period.
- `WS metric/transactions/data` — Units: Total units sold across transactions in the period.
- `WS metric/transactions/data` — Average transaction value: Mean value of each transaction — total volume divided by transaction count.
- `WS metric/transactions/data` — Units per transaction: Average units sold per transaction — total units divided by transaction count.
- `WS metric/transactions/conversion-rate` — Conversion rate: Transactions per location entrant — retail POS conversion against footfall.
#### Heatmaps & Thumbnails
- `WS detail/list (heatmap)` — Heatmaps: Spatial heatmaps — path, linger, entry, exit, and interaction patterns.
- `WS detail/list (thumbnail)` — Thumbnails: Camera thumbnails associated with a location, recording, line, or area.
- `WS detail/list (thumbnails-with-statelems)` — Thumbnails with overlays: Camera thumbnails with overlaid stat-element coordinates (lines, areas).
#### Uptime
- `WS metric/uptime` — Historic uptime: Recording-, location-, or organisation-level uptime over a date range.
- `WS status/uptime` — Real-time status: Real-time uptime status of locations or recordings — not subject to historic refresh delays.
#### Exports
- `WS external-service/csv-generator` — CSV generator: Combine one or more metric queries into a single CSV, returned as a signed S3 download URL.
## Privacy & Compliance
Aura Vision is privacy-by-design. A legal opinion from Mishcon de Reya (December 2025) confirms: "Aura Vision's insights and analytics are anonymised data, do not constitute personal data under the EU GDPR and UK GDPR, and are created in line with regulatory guidance."
### Privacy by Design
- **100% anonymous** — video converted to anonymous analytics on-premise, then immediately discarded. Only aggregated counts reach the cloud.
- **Face blurring** — non-reversible, applied at source before any image leaves the device
- **No video storage** — no historic footage stored or recalled
- **No customer sign-up** — no T&Cs or WiFi sign-ups required
- **Edge processing** — all video processed on-device
- **No sensitive data** — no Special Categories of Personal Data (Art. 9 GDPR) collected
- **Clean heatmaps** — heatmaps and thumbnails pre-cleaned to remove any visible person
### Compliance
- **GDPR** compliant — acts as Data Processor; client is Data Controller
- **CCPA** compliant (California Consumer Privacy Act)
- **EU AI Act** — assessed as limited/minimal risk by Mishcon de Reya
- **ICO registered** (UK Information Commissioner's Office)
- **ISO 27001** aligned information security management
### Security
- **Firmware signing** — all software shipped to APUs is signed with Aura Vision's secret key
- **Encrypted filesystem** — root filesystem on every APU is encrypted
- **End-to-end encryption** — AES-128 in transit (HTTPS/TLS v1.3), AES-256 at rest
- **No inbound connections** — APUs don't accept inbound connection requests
- **AWS hosted** — all web services on Amazon Web Services
- **Auth0** — SSO, LDAP, and Multi-Factor Authentication
- **Role-based access control** — customisable permission levels
## Company Timeline
- **2017** — Founded after completing PhDs in Computer Vision and Machine Learning at the University of Southampton
- **2018** — First prototype exhibited at CES, Las Vegas; featured on BBC Click
- **2019** — Joined Y Combinator (W19), moved to Silicon Valley, raised a $3M seed round, attended NRF New York
- **2020** — Helped retailers adapt stores during COVID-19 with real-time occupancy monitoring
- **2022** — Expanded first enterprise retail client to several hundred locations; grew team in London
- **2024** — Partnered with Telefonica's Business team with Spatial Insights white label
- **2026** — Launched Ask Aura — AI-powered natural language interface for instant retail answers
## Company Values
- **Privacy by design** — protecting individual privacy is built into the technology from the ground up
- **Scalability first** — designed to ensure clients can scale full-location coverage to every store
- **Customer obsessed** — helping clients engage every customer and maximise the value of every visit
- **Data guided** — every strategy and product decision backed by evidence and measurement
- **Continuous improvement** — never stop learning and getting better
- **Empower everyone** — empower every team member and client to work smarter with better information
## Knowledge Base
The Aura Vision knowledge base is organised by topic, with definitions and FAQs grouped together inside each section:
**Getting Started** — Orientation: what Aura Vision is, how it's installed, what insights you get.
**Tutorials** — Step-by-step interactive walkthroughs of the most common workflows.
**Analytics** — Footfall, areas, heatmaps, demographics, conversion and headcount planning.
**Setup** — Installation, integrations, data access, admin and troubleshooting.
**Privacy & Security** — AI privacy, on-device processing, encryption and compliance.
A standalone glossary index lives at https://auravision.ai/knowledge/glossary.
Full index at https://auravision.ai/knowledge.
### Getting Started
#### What is Aura Vision?
Aura Vision is a retail analytics platform that turns your existing CCTV cameras into anonymous, privacy-safe insights into how customers and staff move, browse and engage across your store.
https://auravision.ai/knowledge/getting-started/an-overview-of-aura-vision
Aura Vision is a retail analytics platform that helps you understand what is actually happening on the shop floor. Using the cameras you already have, it produces anonymous, privacy-safe measurements of how customers and staff move, browse and engage — so you can make better decisions about layout, staffing and store performance with confidence.
## What it measures
Aura Vision turns video into a rich set of in-store metrics, all available in 15-minute intervals and segmented by area, demographic and staff-vs-customer:
- **Traffic** — entries, passers-by, capture rate, occupancy.
- **Engagement** — dwell time, area visits, popular paths, heatmaps.
- **Service** — queue lengths, wait times, staff coverage.
- **Demographics** — age and gender segmentation across every interaction.
- **Conversion** — when paired with sales data, footfall-to-sales conversion at any granularity.
## What it is not
- Not a new camera system. Aura Vision works with the IP cameras you already own.
- Not facial recognition. No biometric data is generated or stored — ever.
- Not a black box. Every store is calibrated against ground-truth audits, and accuracy is reported transparently.
## How retailers use it
- **Operations** — match staffing to demand at till points and service desks.
- **Merchandising** — measure how new displays, layouts and signage affect engagement.
- **Marketing** — quantify the in-store impact of campaigns, windows and promotions.
- **Property** — compare stores like-for-lik…
#### How does Aura Vision work?
Aura Vision turns your existing CCTV cameras into anonymous, privacy-safe behaviour analytics. A small on-premise computer — the APU — runs the AI locally, so video never leaves the store. Only aggregated metrics are sent to the cloud.
https://auravision.ai/knowledge/getting-started/how-does-it-work
Aura Vision sits quietly on top of the CCTV infrastructure you already have. Cameras you already own feed video into a small computer in the back office. That computer does all the AI work — counting visitors, recognising staff, mapping movement — and then sends only the resulting numbers to the cloud. Nothing leaves the store that could identify a person.
## The APU
Every store runs one **APU** (Analytics Processing Unit) — an edge computer about the size of a paperback book. It plugs into the same network switch as the cameras, with one cable for the cameras, one for the internet, and one for power.
Because the AI runs on the APU itself, full-resolution video stays inside the store. Every frame is processed and discarded in milliseconds. There is no facial recognition, no biometric ID, and nothing that could be used to single out an individual ever leaves the building.
## The pipeline
The same four steps happen behind the scenes for every store, around the clock:
1. **Camera.** Your existing IP, RTSP or ONVIF cameras stream to the APU over the local network — no new cabling, no new cameras.
2. **APU.** On-device AI counts, classifies and aggregates in real time. Video is processed and immediately discarded.
3. **Cloud.** Only anonymous, aggregated analytics are uploaded — under 50 Kb/s per camera, well within any retail backhaul.
4. **Dashboard.** Your team queries any time-grain, from 15-minute intervals up to multi-year trends, via the web dashboard or REST API.
##…
#### How is Aura Vision installed?
Aura Vision installs by plugging an APU into your existing CCTV camera network — no new cameras or cabling required. A store is live from the moment cameras are connected and configured to capture data.
https://auravision.ai/knowledge/getting-started/how-is-aura-vision-installed
Aura Vision installs by plugging an **APU** (the on-premise device introduced on [How does Aura Vision work?](/knowledge/getting-started/how-does-it-work)) into your existing CCTV network. No new cameras and no new cabling are required. Every store follows the same fixed sequence — kickoff through dashboard go-live — and is live from the moment cameras are connected and configured to capture data.
## After go-live
Installation isn't a one-shot project — it's the start of an ongoing relationship:
- **Accuracy audits.** Every store is audited against ground truth at go-live, and we re-audit periodically to catch model drift from lighting changes, seasonal layouts or new uniforms.
- **Ongoing tuning.** Refits, relocations, camera moves and area changes feed back into the tuning loop so the metrics stay accurate.
- **Support cadence.** We run a weekly check-in during the first month after go-live, then move to monthly steady-state reviews. Reactive support is always available at [support@auravision.ai](mailto:support@auravision.ai).
## Related setup questions
- [What internal resources do we need during installation?](/knowledge/setup/installation/what-internal-resources-do-we-need-during-installation)
- [What type of cameras do we need to have?](/knowledge/setup/installation/what-type-of-cameras-do-we-need-to-have)
- [How does the APU connect to our cameras and internet?](/knowledge/setup/installation/how-does-the-micro-pc-connect-to-our-cameras-and-internet)
- [How can I t…
#### What insights will I get?
From engagement heatmaps and demographic segmentation to anomaly alerts and like-for-like store comparisons, Aura Vision turns raw camera footage into the answers retail teams actually act on.
https://auravision.ai/knowledge/getting-started/what-insights-can-i-get-from-aura-vision
Aura Vision gives multiple teams meaningful, actionable insights that simply can't be captured from sales data alone. Three insight families do most of the heavy lifting.
## 1. How customers move through the store
Heatmaps and paths show you where customers actually spend their time. Compare paths by demographic, by staff-vs-customer, or against another store — and see at a glance which areas are pulling their weight and which aren't.
This is the foundation for almost every other question: *Did the new layout improve dwell? Is the demographic mix what we thought? Why is store A converting at twice the rate of store B?*
## 2. What's happening right now — and what's wrong
Aura Vision streams in real time at 15-minute granularity. That makes it possible to spot anomalies — a queue building at the till, a sudden drop in entries, a campaign that didn't land — within minutes rather than weeks. Pair it with an integration into your messaging tool, and the right person finds out without having to log in to check.
## 3. Like-for-like across the estate
Every metric — capture rate, dwell, queue wait, demographics, conversion — is normalised so stores can be compared like-for-like. Property teams use it to rank performance; merchandising teams use it to roll out winning displays; operations use it to flatten staffing peaks.
## Walkthroughs to get you started
We've put together end-to-end walkthroughs of the highest-value use cases:
1. [How to prove the impact of an in-store cam…
### Tutorials
#### How to optimise staff schedules to meet customer demand
Match labour spend to actual footfall — save resources in quiet hours and lift conversion in busy ones.
https://auravision.ai/knowledge/tutorials/how-to-optimise-staff-schedules-to-meet-customer-demand
Pulling weekly rotas without looking at footfall guarantees over-staffing in quiet hours and under-staffing on peaks. This walkthrough shows how to use Aura Vision's hour-of-day and day-of-week trends to size shifts to actual demand — typically reclaiming **10–15% of labour spend** while protecting conversion in busy hours.
**Who it's for:** store managers, area managers and workforce-planning teams.
**What the video covers:**
1. Open the Explorer view and pull a 4-week hour-of-day footfall trend per store.
2. Overlay current staff rota against the trend to spot mismatches.
3. Identify the two hours per week with the biggest over-staffing gap.
4. Identify the two hours per week with the biggest under-staffing gap.
5. Export the trend as CSV to share with your WFM (workforce management) tool.
## Walkthrough video
#### How to prove the impact of an in-store campaign, trial or pilot
Show stakeholders a measurable lift — footfall, conversion or dwell — against a like-for-like control to justify the spend and decide whether to scale.
https://auravision.ai/knowledge/tutorials/how-to-prove-the-impact-of-an-in-store-campaign
Most retail campaigns get rolled out and then post-rationalised with whatever sales numbers happened to look good. This walkthrough shows how to build a proper before/after comparison against a control set of stores, so the lift you report is defendable — and the decision to scale (or kill) the campaign is based on evidence.
**Who it's for:** marketing, store ops, and analytics teams running pilots, trials or campaigns.
**What the video covers:**
1. Pick the campaign stores and the control stores (similar baseline footfall, region, format).
2. Set the comparison period — pre-campaign baseline and during-campaign window.
3. Compare footfall, conversion, dwell and demographic split across the two store groups.
4. Read the like-for-like uplift and check for confounds (seasonality, weather, local events).
5. Export the chart and summary stats for the readout.
## Walkthrough video
#### How to use demographic insights to build a targeted store campaign
Spot the demographics your store over-indexes on and focus campaign spend where it actually converts — instead of marketing to everyone.
https://auravision.ai/knowledge/tutorials/how-to-use-demographic-insights-to-build-a-targeted-store-campaign
Campaigns aimed at "everyone" usually waste a meaningful chunk of their budget. This walkthrough shows how to use Aura Vision's anonymous age and gender breakdowns to spot the demographic your store over-indexes on — then re-shape the campaign brief, creative and channel mix around the people who actually convert.
**Who it's for:** marketing managers, brand teams and store ops planning local activations.
**What the video covers:**
1. Open the Demographics view and pull a 4-week footfall split by age and gender per store.
2. Compare your store's mix to the brand's national average to spot over- and under-indexing.
3. Cross-reference with conversion to see which segment converts above its visit share.
4. Define the target segment and the secondary audience.
5. Brief the campaign — creative, channel, timing — against that target.
## Walkthrough video
#### How to quickly set up a report email schedule
Stop chasing numbers manually — get the KPIs your team needs delivered to the right inbox each week so they spend time acting, not extracting.
https://auravision.ai/knowledge/tutorials/how-to-quickly-set-up-a-report-email-schedule
Most operational reporting cadences fall apart because someone has to remember to pull the numbers, paste them into a deck, and send them out. This walkthrough shows how to set up a recurring email schedule in Aura Vision so the same KPIs land in your team's inbox every Monday morning — no manual work, no missed reports.
**Who it's for:** anyone responsible for a weekly or monthly reporting cadence.
**What the video covers:**
1. Build the report view you want emailed (footfall, conversion, demographic split, area dwell, etc.).
2. Open the schedule settings and pick the cadence (daily, weekly, monthly).
3. Add the recipients — internal team members or stakeholders outside Aura Vision.
4. Choose the format (PDF, CSV, or both).
5. Save and verify with a test send.
## Walkthrough video
### Analytics
#### Area
An Area is a configurable region of the store — a polygon drawn on the camera view at setup — that becomes its own unit of measurement for entries, dwell, occupancy and queueing.
https://auravision.ai/knowledge/analytics/areas/area
**Area** is a configurable region of the store, drawn as a polygon on the camera view during setup. Each area becomes its own unit of measurement — every entry, dwell second, occupancy reading and (where relevant) queue length is attributed to the area the customer is standing in.
Typical examples include *Footwear*, *Womenswear*, *Fitting Rooms*, *Checkout* and *Service Desk*. Areas trace the floor where customers stand, not the merchandise itself, so the boundary follows behaviour rather than fixtures.
## Sub-areas and parents
Several polygons can roll up into a parent area. *Menswear*, for example, might contain *Accessories*, *Boxers* and *Shorts* — each tracked independently and summed into the parent department. This lets you compare a single display against its category, or a category against the wider floor, without re-mapping anything.
## How areas are configured
Boundaries are drawn during onboarding and audited against ground-truth video samples to confirm accuracy. They are re-mapped whenever the store is refit, a camera is repositioned or new zones are introduced.
## Related
- [Dwell time](/knowledge/analytics/areas/dwell-time)
- [Occupancy](/knowledge/analytics/areas/occupancy)
- [Entry rate](/knowledge/analytics/areas/entry-rate)
- [How are areas mapped?](/knowledge/analytics/areas/how-are-areas-mapped)
#### Average Transaction Value (ATV)
Average Transaction Value (ATV) is the average revenue generated per sales transaction, calculated as total sales divided by the number of transactions over the same period.
https://auravision.ai/knowledge/analytics/conversion/atv
**Average Transaction Value (ATV)** is the average revenue per sales transaction over a given period. It's a standard UK retail KPI showing how much each buying customer spends in a single visit.
**ATV = Total sales / Transactions**
ATV measures basket value, not basket size. For item count per transaction, see [UPT](/knowledge/analytics/conversion/upt) — the two are typically tracked together.
## Worked example
- A store took **£9,000 in sales** today.
- It processed **180 transactions**.
- ATV = £9,000 / 180 = **£50**.
A rising ATV usually reflects effective upselling or a premium product mix. A falling ATV alongside steady footfall often signals discount-heavy trading.
## Related
- [Units Per Transaction (UPT)](/knowledge/analytics/conversion/upt)
- [Sales per visitor](/knowledge/analytics/conversion/sales-per-visitor)
- [Conversion rate](/knowledge/analytics/conversion/conversion-rate)
- [Do you ingest sales data?](/knowledge/analytics/conversion/do-you-ingest-sales-data)
#### Age band
An age band is one of the seven bracketed categories Aura Vision uses to classify a visitor's estimated age — coarser than an exact age, but reliable, useful and privacy-friendly.
https://auravision.ai/knowledge/analytics/demographics/age-band
**Age band** is one of the seven bracketed categories Aura Vision uses to classify a visitor's estimated age. Estimating an exact age from a single video frame is not possible, but classifying into a ten-year band is reliable, useful, and keeps reporting anonymous.
## The seven bands
1. Under 16
2. 16–24
3. 25–34
4. 35–44
5. 45–54
6. 55–64
7. 65+
The bands are fixed — they cannot be redrawn per customer because the underlying model is trained against these specific brackets. The Under 16 band intentionally groups all children and infants together rather than estimating an exact age for minors, which keeps reporting privacy-friendly and robust to the different rates at which children develop physically.
Every demographic breakdown in the dashboard — footfall, dwell, area entries and conversion — supports a split by age band, and bands can be combined with [Gender estimation](/knowledge/analytics/demographics/gender-estimation) for a fuller picture of who is visiting.
See [How accurate is Age recognition?](/knowledge/analytics/demographics/how-accurate-is-age-recognition) for the 85–90% accuracy figure and how it is measured.
#### Headcount planner
The Headcount planner is a dashboard tool that allocates staffing hours across the trading day based on historical footfall, so labour is sized to actual customer demand.
https://auravision.ai/knowledge/analytics/headcount/headcount-planner
**Headcount planner** is a tool inside the Aura Vision dashboard that allocates staffing hours across the trading day based on historical footfall. Instead of building a rota against intuition, managers enter the total staffing hours they have available and the planner distributes them hour-by-hour to match real demand.
## How it works
The output is a coloured grid covering the trading week, with one cell per hour. Each cell contains a number — a **staffing hour** — representing how many people should be on the floor during that slot. A 4, for example, means four staffing hours (typically four people) are needed for that hour.
The distribution is driven by historical footfall patterns for the store, so peaks pull staff in and quiet hours release them. This lets retailers reclaim labour from over-staffed quiet periods and protect conversion during peaks, without changing the overall headcount budget.
For an end-to-end walkthrough, see [How to optimise staff schedules to meet customer demand](/knowledge/tutorials/how-to-optimise-staff-schedules-to-meet-customer-demand).
## Related
- [What do the numbers in the coloured grid indicate?](/knowledge/analytics/headcount/what-do-the-numbers-in-the-coloured-grid-indicate)
#### Footfall
Footfall analytics is the practice of measuring and analysing the number of people entering a physical space — such as a retail store, shopping centre, or transport hub — to understand visitor patterns, evaluate performance, and make data-driven decisions.
https://auravision.ai/knowledge/analytics/footfall/footfall
## What is footfall analytics?
Footfall analytics is the measurement, collection, and analysis of pedestrian traffic data in physical spaces. It answers the most fundamental question in brick-and-mortar retail: **how many people are coming into your store, and when?**
While the concept of counting visitors is decades old, modern footfall analytics goes far beyond simple headcounts. Today's systems can distinguish between staff and customers, track visitor flow between store zones, segment by demographics, and correlate foot traffic with sales data — all in real time.
## Why footfall analytics matters
For any physical business, understanding visitor volume is the foundation of performance measurement. Without accurate footfall data, retailers are essentially flying blind:
- **Sales conversion becomes measurable.** If 1,000 people visit your store and 50 make a purchase, your conversion rate is 5%. Without footfall data, you only see 50 transactions — you have no idea whether your store attracted 500 visitors or 5,000.
- **Marketing ROI becomes provable.** Did that window display campaign actually drive more people through the door? Footfall data gives you the before-and-after comparison.
- **Staffing can be optimised.** By overlaying footfall patterns with staff schedules, retailers can ensure they have the right number of people on the floor during peak hours — and aren't overstaffed during quiet periods.
- **Lease negotiations are informed.** Shopping centre tenants can…
#### Heatmap
Retail heatmaps are visual representations of customer activity within a physical store, using colour gradients to show where people spend the most time, how they move through the space, and which areas receive the highest engagement.
https://auravision.ai/knowledge/analytics/heatmaps/heatmap
## What are heatmaps in retail?
Retail heatmaps are data visualisations that show how customers use physical space within a store. Using colour gradients — typically from cool blues (low activity) to hot reds (high activity) — they transform complex movement data into an intuitive picture that any retailer can understand at a glance.
If you've seen a website heatmap showing where users click or scroll, retail heatmaps are the physical-world equivalent: they show where shoppers go, where they stop, and where they don't.
## Types of retail heatmaps
### Total time (dwell) heatmaps
These show the cumulative time spent by all visitors in each area of the store. Hot spots indicate areas where people linger — browsing products, engaging with displays, or waiting in queues. Cold spots reveal areas that shoppers pass through quickly or ignore entirely.
**Best for:** Identifying high-engagement zones, evaluating product display effectiveness, spotting dead zones
### Popular path heatmaps
These visualise the most common routes customers take through the store. Rather than showing where people stop, they show how people flow — the corridors, aisles, and navigation patterns that define the customer journey.
**Best for:** Store layout evaluation, understanding natural traffic flow, identifying bottlenecks
### Comparative heatmaps
By overlaying heatmaps from different time periods (before vs. after a layout change, weekday vs. weekend, or promotion vs. non-promotion periods), retail…
#### Average dwell
Average Dwell is the average time a single visitor spends inside an area — Total Dwell divided by the number of people who entered. It tells you how engaging an area is per visit.
https://auravision.ai/knowledge/analytics/areas/average-dwell
**Average Dwell = Total Dwell / Entries**
It's the average time a single visitor spends inside an area. Where Total Dwell measures the area's full engagement budget, Average Dwell measures **engagement per visit**.
## Worked example
- 50 customers entered the Footwear area today.
- Their combined dwell time was 5,400 seconds (1h 30m).
- Average Dwell = 5,400 / 50 = **108 seconds per visit (1m 48s)**.
## What changes the number
- **Compelling merchandise or display** raises Average Dwell — shoppers stop and look.
- **Crowded or hard-to-navigate areas** can also raise Average Dwell, but for the wrong reason (people stuck rather than engaged). Cross-reference with conversion to tell the two apart.
- **Quick-pickup areas** (basket grabs, accessories impulse) have naturally low Average Dwell. That's not a problem — context matters.
## How to use it
- **Compare like-for-like areas** across stores to spot under-performing merchandising.
- **Track over time** to see whether a new display or layout change moves the needle.
- **Pair with conversion** — high dwell + low conversion usually points at a product or price issue; low dwell + low conversion points at a discovery issue (the right people aren't reaching the area).
## Related
- [How is Total Dwell calculated?](/knowledge/analytics/areas/total-dwell)
- [What is occupancy?](/knowledge/analytics/areas/occupancy)
- [How is Conversion rate calculated?](/knowledge/analytics/conversion/conversion-rate)
#### Conversion rate
Conversion rate is the number of customer sales transactions divided by the number of store entries, expressed as a percentage. It tells you how many visitors became buyers.
https://auravision.ai/knowledge/analytics/conversion/conversion-rate
**Conversion rate = Transactions / Customer entries × 100**
It's the percentage of customer visitors who made a purchase. It's calculated from the sales transactions you connect to Aura Vision divided by the footfall Aura Vision counts at your store entrances.
## Worked example
- A store had **1,200 customer entries** today (staff excluded).
- It processed **180 sales transactions**.
- Conversion rate = 180 / 1,200 = **15%**.
## What's counted in each side of the equation
- **Entries** — only customer entries. Staff are recognised by their uniform and excluded from the denominator so conversion isn't artificially diluted by team movement.
- **Transactions** — supplied by your POS, either via daily upload, scheduled push, or live API.
## Why this is more accurate than dashboard-only conversion
Most retail conversion numbers divide transactions by total door-counts — staff, deliveries and security included. Aura Vision strips those out at the source, so the rate reflects actual customer behaviour.
## Related
- [Do you ingest sales data?](/knowledge/analytics/conversion/do-you-ingest-sales-data)
- [What is counted as an entry?](/knowledge/analytics/footfall/entry-line)
- [What is a Capture rate?](/knowledge/analytics/footfall/capture-rate)
#### Gender estimation
Gender estimation is the anonymous classification of each visit as male or female based on body shape, gait and clothing — never facial recognition — with results reported only as aggregate counts.
https://auravision.ai/knowledge/analytics/demographics/gender-estimation
**Gender estimation** is the anonymous classification of each visit as male or female. The AI looks at body shape, posture, gait and clothing to make the call — it does not analyse or store faces, and it does not identify individuals.
## How it's measured
A visitor is detected as they enter the camera view and tracked through the space as a single anonymous instance. The model assigns an estimated gender to that instance, which is added to the aggregate count for the period. No image or personal record is retained — only the count.
Because the signal comes from full-body cues rather than facial features, gender estimation continues to work in low light, at oblique camera angles, and from overhead views where a face would not be visible.
Output is always aggregate. The dashboard reports the male/female split of footfall, dwell, area entries and conversion, and the breakdown can be combined with [Age band](/knowledge/analytics/demographics/age-band) to segment by demographic group.
See [How accurate is gender recognition?](/knowledge/analytics/demographics/how-accurate-is-gender-recognition) for the 95% accuracy figure and how it is measured.
#### Passer-by
Using the camera view of the store entrance, we are able to capture a sample of people passing by the store. We draw a virtual line outside the entrance and...
https://auravision.ai/knowledge/analytics/footfall/passer-by
The Passers-by metric is also used to calculate your Capture rate, a powerful indicator of success in converting external footfall into store traffic.
Whilst entry counts are an absolute measure — capturing every individual who walks into the store — Passers-by counts represent a sample of external traffic. These can be influenced by several factors, including the quality of the camera view outside the entrance, external obstructions that affect customer movement, and the type of location (high street, shopping mall, or retail park).
Please refer to [this article on Capture rates](#related-capture-rate), which includes tips on how to use Passers-by and Capture rate insights.
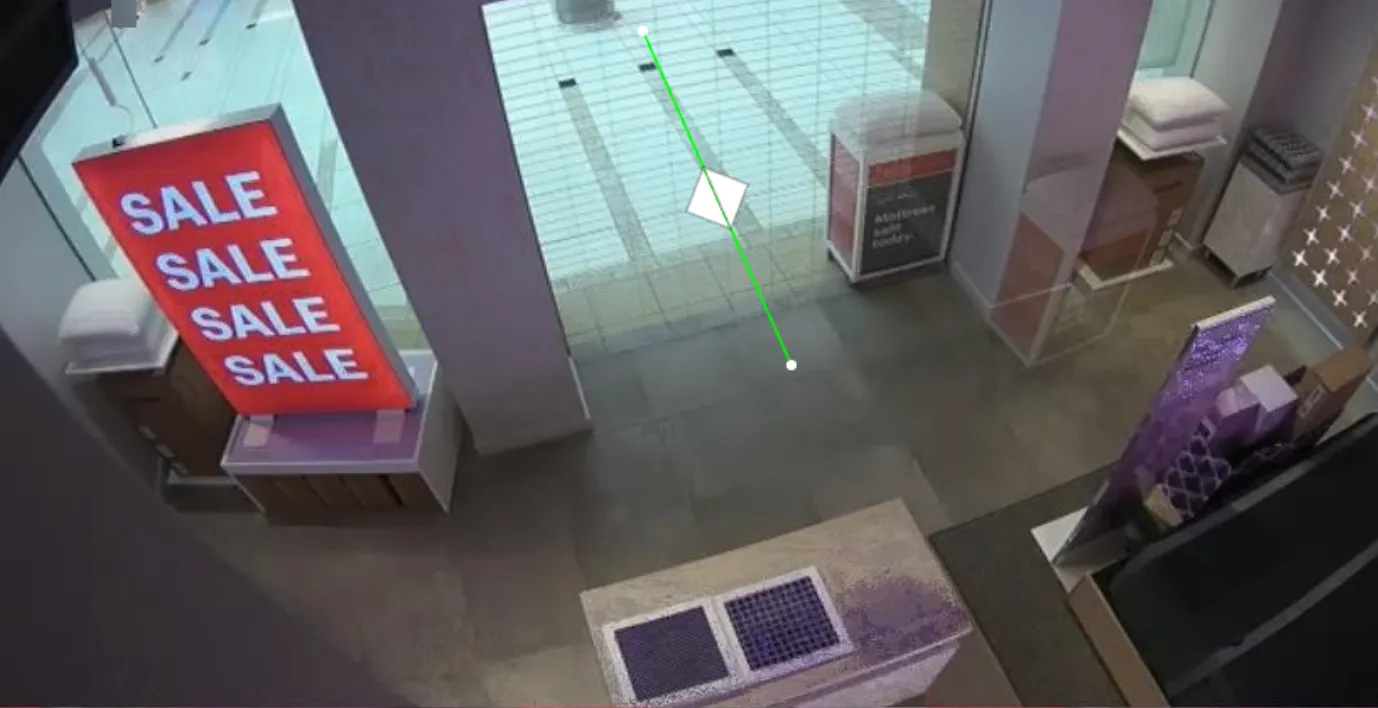
_An example of a Passers-by line outside a typical shopping mall store_
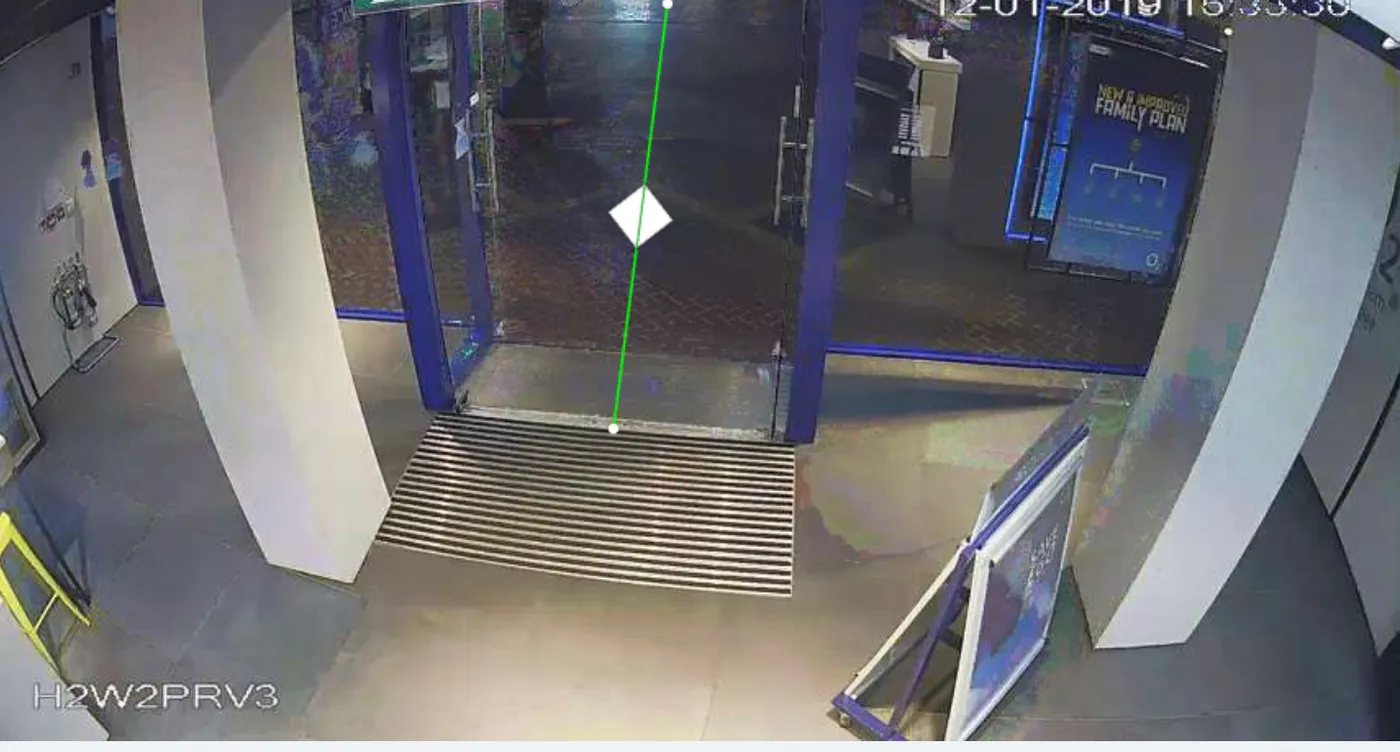
_An example of a Passers-by line outside a typical high street store_
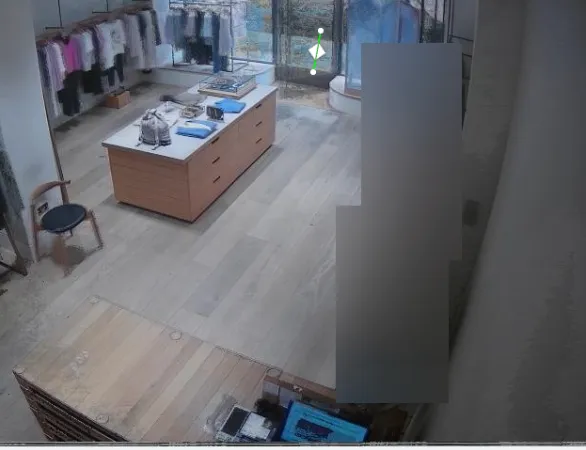
_In this example, the view of Passers-by traffic is limited by the camera view and the size of the entrance_
#### Popular Path heatmap
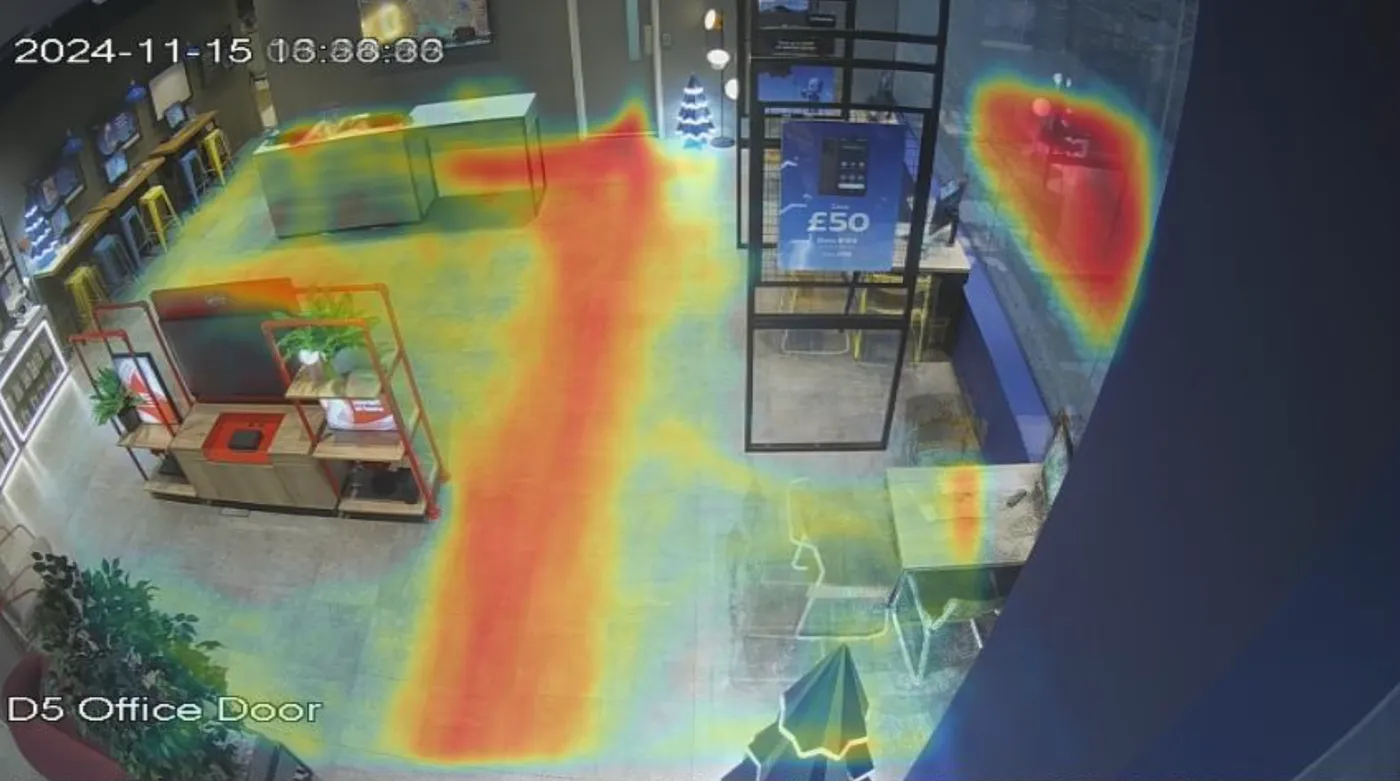
A Popular Path heatmap shows the most-walked routes through the store — where customers actually move, not just where they stop. Red traces are the busiest paths; cool traces are rarely-used routes.
https://auravision.ai/knowledge/analytics/heatmaps/popular-path-heatmap
A **Popular Path heatmap** shows the most-walked routes through the store — where customers actually move, not just where they stop. Red traces mark the busiest paths; cool traces are rarely-used routes.
## How it's plotted
Aura Vision aggregates the routes every customer walked across the period you select. Each customer's path contributes to the heatmap; the more customers who walked the same route, the redder the line.
## What it's useful for
- **Layout decisions.** See whether customers follow the path you designed or carve a different desire-line through the store.
- **Sightline gaps.** A merchandising zone that's logically positioned but rarely walked past usually has a sightline or signage problem at the prior decision point.
- **Wayfinding.** Confirm whether new signage or fixtures shifted the dominant route after a refit.
- **Underused floor space.** Cool regions next to high-traffic routes are candidates for promotional displays or re-purposing.
## How it differs from a Total Time heatmap
- **Popular Path** weights movement: where customers walk.
- **Total Time** weights dwell: where customers stop.
A pinch-point near the entrance will show on Popular Path even if no one stops there. A destination display will show on Total Time even if it's off the main route.
## Related
- [What is a Total Time Heatmap?](/knowledge/analytics/heatmaps/total-time-heatmap)
- [What are heatmaps?](/knowledge…
#### Dwell time
Dwell time is the time customers spend inside an area or the wider store — the umbrella metric for measuring engagement with a space.
https://auravision.ai/knowledge/analytics/areas/dwell-time
**Dwell time** is the time customers spend inside an area or the wider store. It's the umbrella concept Aura Vision uses to measure how much of a customer's visit was actually spent engaging with a space, rather than passing through it.
## The three dwell metrics
Aura Vision exposes three specific dwell metrics, each answering a slightly different question:
- **Total dwell** — the sum of every visitor's dwell time inside an area. Best for comparing areas or periods, because it captures both volume and engagement.
- **Average dwell** — Total dwell divided by entries. Best for engagement quality — how compelling an area is for the people who do step in.
- **Store dwell** — the average time a customer spends in the store as a whole, measured across one or more dwell areas mapped over the shop floor.
## The 5-second rule
For area dwell, a visitor only starts contributing once they've been inside the polygon for **5 seconds or longer**. Shorter passes — shoppers cutting across an area on the way somewhere else — are filtered out, so dwell reflects intentional engagement rather than transit.
## Related
- [Total dwell](/knowledge/analytics/areas/total-dwell)
- [Average dwell](/knowledge/analytics/areas/average-dwell)
- [Store dwell](/knowledge/analytics/areas/store-dwell)
- [Does it count people who walk through an area?](/knowledge/analytics/areas/does-it-count-people-who-walk-through-an-area)
#### Sales per visitor
Sales per visitor is the average revenue generated per customer entering the store, calculated as total sales divided by customer entries.
https://auravision.ai/knowledge/analytics/conversion/sales-per-visitor
**Sales per visitor** is total revenue divided by customer entries over the same period. It's the all-in metric combining [conversion rate](/knowledge/analytics/conversion/conversion-rate) and [ATV](/knowledge/analytics/conversion/atv) into a single number — the average value each visitor, buyer or not, generates.
**Sales per visitor = Total sales / Customer entries**
Because the denominator is customer entries (staff excluded), the metric reflects real shopper value rather than door-count noise.
## Worked example
- A store took **£9,000 in sales** today.
- Aura Vision counted **1,200 customer entries** (staff excluded).
- Sales per visitor = £9,000 / 1,200 = **£7.50**.
The same figure equals conversion rate × ATV, making it easy to see whether changes are driven by more buyers, bigger baskets, or both.
## Related
- [Conversion rate](/knowledge/analytics/conversion/conversion-rate)
- [Average Transaction Value (ATV)](/knowledge/analytics/conversion/atv)
- [Units Per Transaction (UPT)](/knowledge/analytics/conversion/upt)
- [Do you ingest sales data?](/knowledge/analytics/conversion/do-you-ingest-sales-data)
#### Staff segmentation
Staff segmentation is the process of separating employees from customers in the count by training the AI to recognise a distinctive visual cue — typically a uniform, polo, apron or lanyard.
https://auravision.ai/knowledge/analytics/demographics/staff-segmentation
**Staff segmentation** is the process of separating employees from customers in the count, so that footfall, conversion, dwell and area metrics reflect only genuine shoppers. Aura Vision does this by training the AI to recognise a distinctive visual cue worn by the team — typically a branded uniform, polo shirt, apron or lanyard.
## How the cue is set
During onboarding, the setup team fine-tunes the model on sample images of your team wearing the chosen cue at the store. From that point on, anyone in view wearing the cue is classified as staff and excluded from customer-facing metrics; anyone without it is counted as a customer.
The cue is tuned per store, so a brand running different uniforms across regions can have each location calibrated independently. It works best when it contrasts clearly with everyday clothing — a white lanyard against a white shirt is harder for the model to lock onto than a coloured one.
If the uniform changes, or staff are temporarily out of uniform, the model needs a re-tune to maintain accuracy. See [How accurate is Staff recognition?](/knowledge/analytics/demographics/how-accurate-is-staff-recognition) for the 99% accuracy figure and the conditions it depends on.
#### Capture rate
Capture rate is the percentage of people walking past the store who actually come in — a sample of external footfall converted into store entries.
https://auravision.ai/knowledge/analytics/footfall/capture-rate
The **capture rate** is the percentage of people walking past your store who actually come in. It's the conversion step before any in-store conversion — turning outside footfall into customers on the floor.
## How it's calculated
**Capture rate = Store entries / (Store entries + Passers-by) × 100**
Both inputs come from the same camera at the entrance — one counts who came in, the other counts who walked past without entering.
## Worked example
- A store sees **2,500 entries** in a day.
- The same entrance camera counts **7,500 passers-by** during opening hours.
- Capture rate = 2,500 / (2,500 + 7,500) = **25%**.
A quarter of the people walking past the door stepped inside.
## Why it matters
Capture rate measures the **front-window pull** of your store — branding, signage, visual merchandising, weather, time of day. When it changes, it almost always points to something *outside* the store, not in-store conversion.
- A new window display goes up → capture rate rises before any sales metric reacts.
- A high-street neighbour shuts → passers-by drop and capture rate moves with them.
- Two stores with the same conversion rate but different capture rates are competing for very different volumes of attention.
## Related
- [What is a Passer-by?](/knowledge/analytics/footfall/passer-by)
- [What is counted as an entry?](/knowledge/analytics/footfall/entry-line)
- [How is Conversion rate calculated?](/knowledge/analytics/conversion/conversion-rate)
#### Total Time heatmap
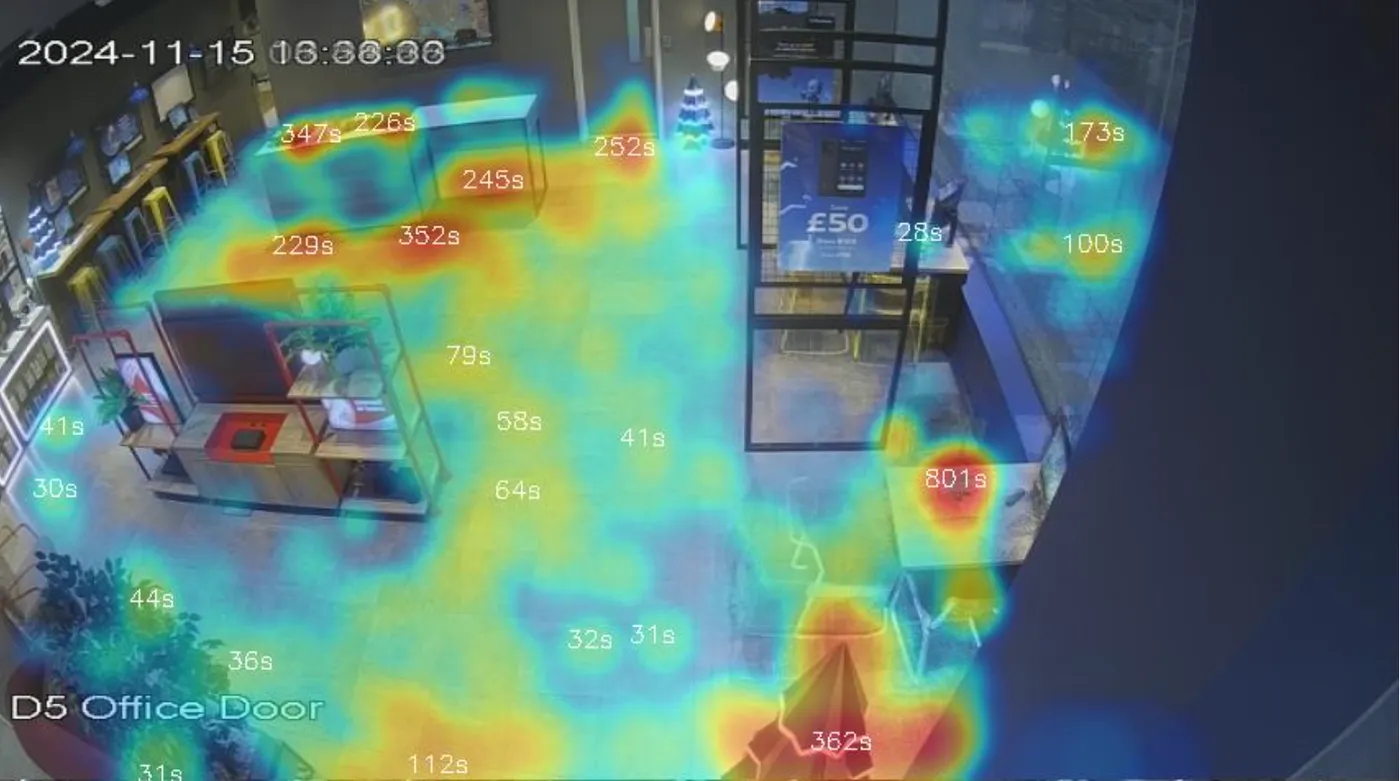
A Total Time heatmap shows where customers spend time across the store. Red areas indicate the longest cumulative dwell; cool areas indicate quick passes or empty floor.
https://auravision.ai/knowledge/analytics/heatmaps/total-time-heatmap
A **Total Time heatmap** shows where customers spend time across the store. Red areas indicate the longest cumulative dwell; cool blue areas indicate quick passes or empty floor.
## How it's plotted
Aura Vision aggregates the time every customer spent at each point on the floor over the period you select (a day, a week, a month). Only dwell longer than 5 seconds is counted, which filters out shoppers cutting straight through. The result is a smooth overlay on the camera view's floor plan.
## What it's useful for
- **Spot real engagement vs. assumed engagement.** The hottest spots are often not where merchandising teams expect — natural pinch-points (entrance, till queue, fitting rooms) compete with display-driven dwell.
- **Before-and-after comparisons.** Run one heatmap before a layout change and one after to see whether dwell genuinely shifted to the new display.
- **Underperforming zones.** Cool spots near merchandise you want shoppers to engage with point at discoverability or sightline issues — not necessarily product or price.
## How it differs from a Popular Path heatmap
- **Total Time** answers *"where do customers spend their time?"* — weighted by dwell.
- **Popular Path** answers *"where do customers walk?"* — weighted by movement.
Use Total Time for engagement and merchandising decisions; use Popular Path for layout, signage and circulation.
## Related
- [What is a Popular Path Heatmap?](…
#### Entry rate
Entry rate is the percentage of store visitors who step into a specific area — how well the area pulls customers in once they're already in the store.
https://auravision.ai/knowledge/analytics/areas/entry-rate
**Entry rate** is the percentage of store visitors who step into a specific area. It measures how well an area pulls customers in once they're already inside the store.
## How it's calculated
**Entry rate = Area entries / Total store entries × 100**
Both inputs come from Aura Vision: total store entries from the entrance camera, area entries from the camera covering that area.
## Worked example
- A store sees **1,000 customer entries** today.
- **320 of those** step into the Footwear area.
- Entry rate for Footwear = 320 / 1,000 = **32%**.
## Why it matters
Entry rate is the **in-store discoverability** measure — it tells you whether the area is positioned, signed and merchandised to draw customers in.
- A new department launch at 15% entry rate means most visitors aren't even discovering it. Worth investigating wayfinding and sightlines.
- A flagship department at 80% entry rate is doing its job at the discovery stage; performance issues from there are about dwell, engagement or conversion, not discovery.
- Two areas with similar visitor counts but different entry rates against the same total reveal which is genuinely magnetic vs. which is just lucky on traffic flow.
## How it differs from Capture rate
- **Capture rate** measures *external* footfall → *store* entries (the front-window pull).
- **Entry rate** measures *store* entries → *area* entries (the in-store pull).
Same shape of metric, different layer of the funnel.
## Related
- [What is a Capture rate?](/…
#### Transaction
A transaction is the unit of sales data Aura Vision ingests — one purchase, one receipt — used as the denominator of basket metrics and the numerator of conversion rate.
https://auravision.ai/knowledge/analytics/conversion/transaction
**A transaction** is a single completed purchase — one receipt at the till. It's the unit of sales data Aura Vision ingests from your POS and the building block behind every conversion and basket metric in the dashboard.
One transaction can contain many items (see [UPT](/knowledge/analytics/conversion/upt)) and any basket value (see [ATV](/knowledge/analytics/conversion/atv)). Refunds and voids are typically excluded so the count reflects net buying behaviour.
## How transactions feed the dashboard
- **Conversion rate** uses transaction count as the numerator against customer entries.
- **ATV** divides total sales by transaction count.
- **UPT** divides total units sold by transaction count.
## Worked example
- A store records **180 transactions** in a day, with **£9,000 in net sales** and **450 units sold**.
- ATV = £9,000 / 180 = **£50**.
- UPT = 450 / 180 = **2.5 units per transaction**.
- Paired with 1,200 customer entries, that's a [conversion rate](/knowledge/analytics/conversion/conversion-rate) of 15%.
Transactions reach Aura Vision via daily CSV upload, scheduled SFTP push, or live API — see [Do you ingest sales data?](/knowledge/analytics/conversion/do-you-ingest-sales-data).
## Related
- [Conversion rate](/knowledge/analytics/conversion/conversion-rate)
- [Average Transaction Value (ATV)](/knowledge/analytics/conversion/atv)
- [Units Per Transaction (UPT)](/knowledge/analytics/conversion/upt)
- [Do you ingest sales data?](/knowledge/analytics/conversion/do-y…
#### Entry line
The virtual line drawn on each entrance camera during install. When a person crosses it and stays inside the store for at least 2 seconds, an entry is counted — shorter crossings are filtered out.
https://auravision.ai/knowledge/analytics/footfall/entry-line
An **entry line** is the virtual line drawn on each entrance camera during setup. When a person crosses it and remains inside the store for at least 2 seconds, the AI counts one **entry** (also called footfall). Shorter crossings — a staff member stepping out to greet a customer, a delivery courier handing over a parcel — are filtered out.
## How it's drawn
During installation, our team takes a still from each entrance camera and traces the line across the doorway threshold. You can see these lines at any time by opening **Camera Preview** in the dashboard — they appear as green overlays on the live camera image.
## The 2-second rule
Every person who crosses the line and remains in the store for more than 2 seconds is counted as one entry. The 2-second rule keeps the count clean:
- A staff member who steps onto the pavement to greet a customer and steps back in: not counted.
- A delivery driver handing over a parcel without coming inside: not counted.
- A shopper realising they walked into the wrong store and immediately turning around: not counted.
## Edge cases
- **Multiple entrances.** Each entrance gets its own line; the store total is the sum across all entrances, de-duplicated so a customer leaving through one and re-entering through another within a short window isn't double-counted.
- **Groups walking in together.** The AI tracks each individual separately — a family of four counts as four entries.
- **Staff vs customers.** If staff segmentation is enabled, emp…
#### Occupancy
Occupancy is the number of people inside an area at a given moment. It moves up when people enter, down when they leave — a live measure of how busy the area is right now.
https://auravision.ai/knowledge/analytics/areas/occupancy
**Occupancy** is the number of people inside an area at a given moment. It rises when people enter, falls when they leave — a live measure of how busy the area is right now.
## How it's measured
Aura Vision tracks every person from the moment they cross an entry line until the moment they leave the area. Occupancy at any point in time is the count of people currently inside. The dashboard shows live values that update continuously and historical values in 15-minute intervals via the Explorer view.
## Worked example
- At 12:00 the Womenswear area had 8 people inside.
- Between 12:00 and 12:15, 12 new visitors entered and 7 left.
- Occupancy at 12:15 = 8 + 12 - 7 = **13 people**.
## What you can do with it
- **Live floor management** — push extra staff to a department when occupancy spikes.
- **Capacity planning** — see peak loads against floor area to assess if a layout is working.
- **Queue and dwell signals** — sudden occupancy spikes around tills or fitting rooms point at queue build-up.
- **Compliance** — track maximum occupancy against any building or fire-marshal limits.
## How it differs from entries
- **Entries** counts the total flow into the area over a period — a cumulative number.
- **Occupancy** is a snapshot: how many people are in the area *right now*.
A high entry count with low average occupancy means lots of brief visits; a low entry count with high average occupancy means a few visitors who stayed a long time.
## Related
- [How is Total Dwell calc…
#### Units Per Transaction (UPT)
Units Per Transaction (UPT) is the average number of items in each sales transaction, calculated as total units sold divided by the number of transactions.
https://auravision.ai/knowledge/analytics/conversion/upt
**Units Per Transaction (UPT)** is the average number of items sold per transaction. It measures basket size by item count, and is most useful read alongside [ATV](/knowledge/analytics/conversion/atv) — together they show whether revenue is driven by more items, pricier items, or both.
**UPT = Total units sold / Transactions**
A higher UPT means customers are buying more items per visit, typically reflecting effective cross-selling, add-on prompts at the till, or strong bundle offers.
## Worked example
- A store sold **450 units** today.
- It processed **180 transactions**.
- UPT = 450 / 180 = **2.5 units per transaction**.
If UPT rises while ATV holds steady, the average item price has dropped — useful context when reviewing promotional periods.
## Related
- [Average Transaction Value (ATV)](/knowledge/analytics/conversion/atv)
- [Sales per visitor](/knowledge/analytics/conversion/sales-per-visitor)
- [Conversion rate](/knowledge/analytics/conversion/conversion-rate)
- [Do you ingest sales data?](/knowledge/analytics/conversion/do-you-ingest-sales-data)
#### People counting
People counting is the technology and practice of measuring the number of individuals passing through a specific point or area — typically a store entrance, corridor, or zone — using sensors, cameras, or AI-powered systems.
https://auravision.ai/knowledge/analytics/footfall/people-counting
## What is people counting?
People counting is the process of measuring the number of people entering, exiting, or occupying a physical space. It is the foundational technology behind footfall analytics and is used across retail, transport, hospitality, corporate offices, and public spaces.
While the concept is simple — counting people — the implementation varies enormously in sophistication, accuracy, and the additional insight it can deliver beyond basic counts.
## People counting technologies compared
### Infrared beam counters
The simplest and oldest technology. A beam of infrared light crosses the entrance; each time it's broken, a count is registered.
**Pros:** Low cost, easy to install
**Cons:** Cannot count groups walking abreast, counts objects as well as people, no directional data (entry vs. exit), no demographic or behavioural insight
**Typical accuracy:** 70–85%
### Thermal imaging sensors
Ceiling-mounted sensors detect body heat signatures to count people passing underneath.
**Pros:** Works in all lighting conditions, directional (in vs. out)
**Cons:** Expensive per entrance, struggles with very crowded environments, affected by ambient heat sources, no additional analytics
**Typical accuracy:** 85–95%
### Stereo-vision / 3D depth cameras
Dual-lens cameras create a depth map to identify people by their 3D shape.
**Pros:** Good accuracy, directional, less affected by shadows than 2D
**Cons:** Requires dedicated hardware at each entrance, limited field …
#### Queue length
Queue metrics are essentially occupancy metrics that capture activity within defined service areas, most commonly the till or cash desk.
https://auravision.ai/knowledge/analytics/areas/queue-length
In addition to measuring the volume of people entering the area (entries and [entry rates](#related-entry-rate)) and the time they spend there ([Total time](#related-total-dwell) and [Average time](#related-average-dwell)), we also calculate queue size using two key metrics:
1. Average queue length: the average number of people in the queue during the selected time period.
2. Maximum queue length: the highest number of people observed in the queue during the selected time period.
These metrics can also be used to measure staff occupancy behind the cash desk (if that area has been defined in your store setup), allowing you to generate actionable insights into the ratio of customers to staff.
#### Retail analytics
Retail analytics is the practice of collecting, measuring, and analysing data from retail operations to understand performance, customer behaviour, and market trends — enabling better decision-making across merchandising, marketing, staffing, and store design.
https://auravision.ai/knowledge/analytics/footfall/retail-analytics
## What is retail analytics?
Retail analytics encompasses all the methods, technologies, and processes used to turn raw retail data into actionable insights. It spans the entire retail operation: from understanding who walks into the store and what they do, to evaluating supply chain efficiency and forecasting demand.
At its core, retail analytics answers questions like:
- How many people visited my store today?
- What percentage of visitors made a purchase?
- Which areas of the store attract the most engagement?
- Are my staff schedules aligned with peak customer demand?
- Did my latest campaign drive more traffic or higher conversion?
## The evolution of retail analytics
### Phase 1: Transaction data (1990s–2000s)
The first era of retail analytics focused almost exclusively on point-of-sale (POS) data. Retailers could see what sold, when, and at what price — but had no visibility into the behaviour that led to (or didn't lead to) a purchase.
### Phase 2: Online analytics (2000s–2010s)
E-commerce introduced sophisticated analytics capabilities. Web platforms could track every interaction — page views, click paths, cart abandonment, A/B test results — giving online retailers an enormous competitive advantage in understanding their customers.
### Phase 3: In-store analytics (2010s–present)
Physical retailers began adopting technologies to close the "data gap" with online. Wi-Fi tracking, Bluetooth beacons, footfall sensors, and eventually computer vision brought web-ana…
#### Store dwell
Store Dwell time is the average time a customer spends in the store.
https://auravision.ai/knowledge/analytics/areas/store-dwell
In addition to product and service areas, we map a dwell area across the shop floor so that we can calculate the average time customers spend in the store. We may create several of these areas depending on the size of the store and the number of camera views. For stores with multiple floors, for example, we will map dwell sections for each floor.
#### Total dwell
Total Dwell is the sum of time spent inside an area across every visitor — the area's full engagement budget for the period.
https://auravision.ai/knowledge/analytics/areas/total-dwell
**Total Dwell = Σ (each visitor's dwell time in the area)**
It's the sum of time every visitor spent inside the area during the period. Think of it as the area's full engagement budget for the day, week or month.
## Worked example
- 50 customers entered the Footwear area today.
- 30 of them dwelled for 60 seconds each → 1,800 seconds.
- 20 of them dwelled for 180 seconds each → 3,600 seconds.
- **Total Dwell = 5,400 seconds (1h 30m)** for Footwear today.
## How dwell per visitor is measured
A visitor enters Total Dwell once they cross the area boundary and pass the 5-second threshold. The clock stops when they leave the area or the store. The 5-second rule excludes passers-through.
## When to use Total Dwell vs. Average Dwell
- **Total Dwell** is the right metric for **comparing areas** or **comparing periods** — it captures both volume and engagement.
- **Average Dwell** (per visitor) is the right metric for **engagement quality** — how compelling the area is for the people who do step in.
A high Total Dwell with a low Average Dwell usually means lots of visitors but short interactions — typical for a high-traffic display. A low Total Dwell with a high Average Dwell means fewer but more engaged visitors — typical for a destination or service zone.
## Related
- [How is Average Dwell calculated?](/knowledge/analytics/areas/average-dwell)
- [What is occupancy?](/knowledge/analytics/areas/occupancy)
- [Does it count people who walk through an area?](/knowledge/analytics…
#### Do you count groups of people?
We count and provide insights on every individual who enters the store, product and service areas.
https://auravision.ai/knowledge/analytics/footfall/do-you-count-groups-of-people
Our product does not make assumptions about groups. Whilst it is possible that a family may enter the store together, it is also possible that they may shop individually, each taking a different journey through the space.
If demographics are enabled for your organisation, it is possible to filter by specific age groups. For example, children under 16 years old can be excluded from the data.
#### Can you count entries across multiple entrances?
Yes, we can track entries across multiple entrances.
https://auravision.ai/knowledge/analytics/footfall/can-it-track-multiple-entrances
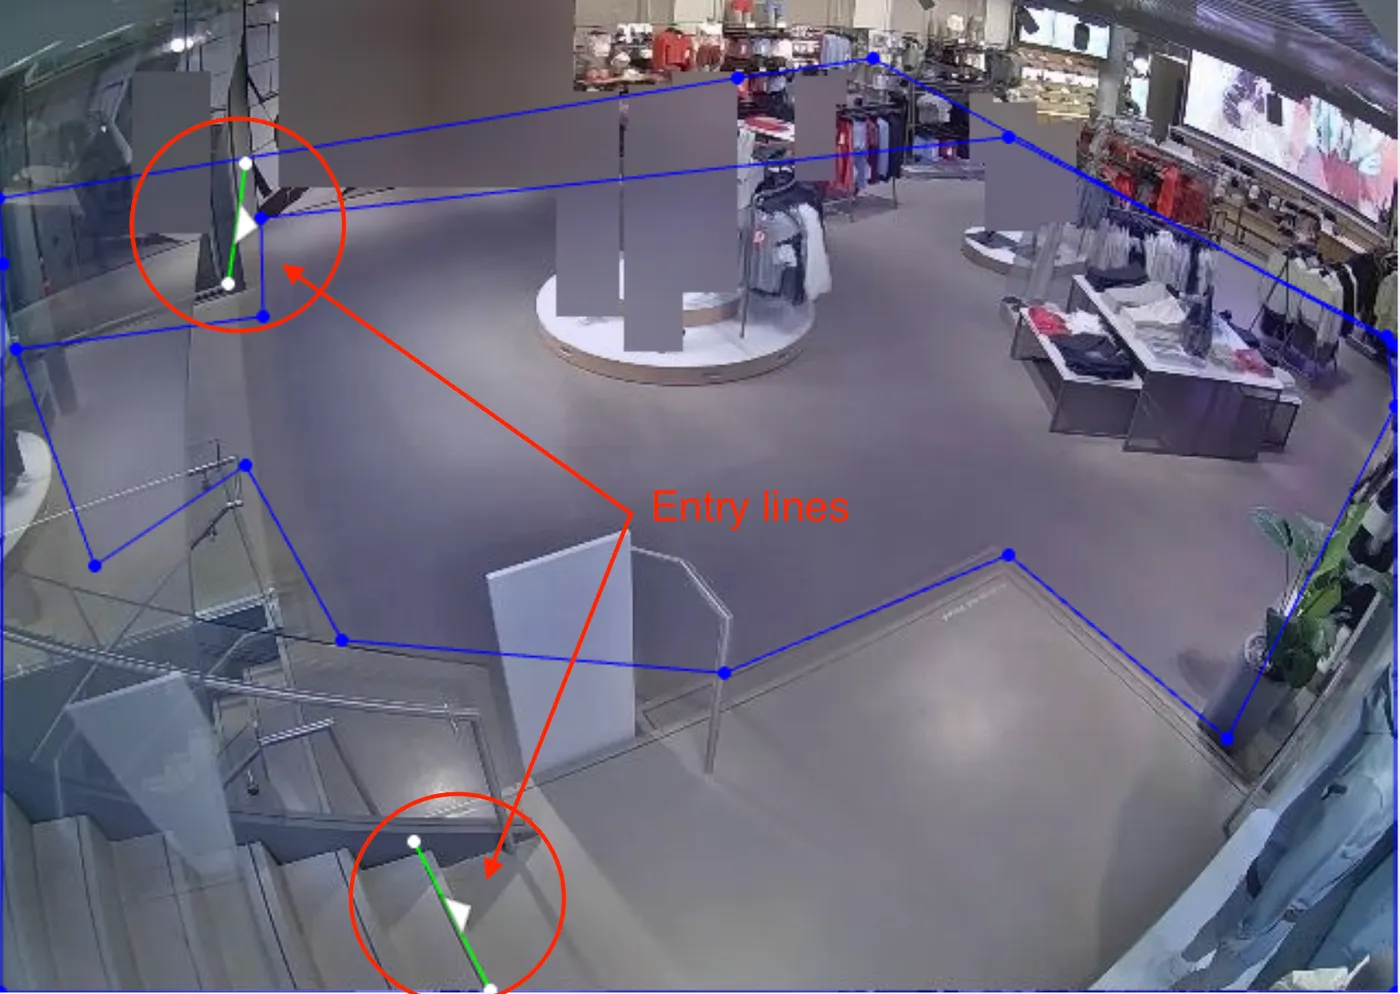
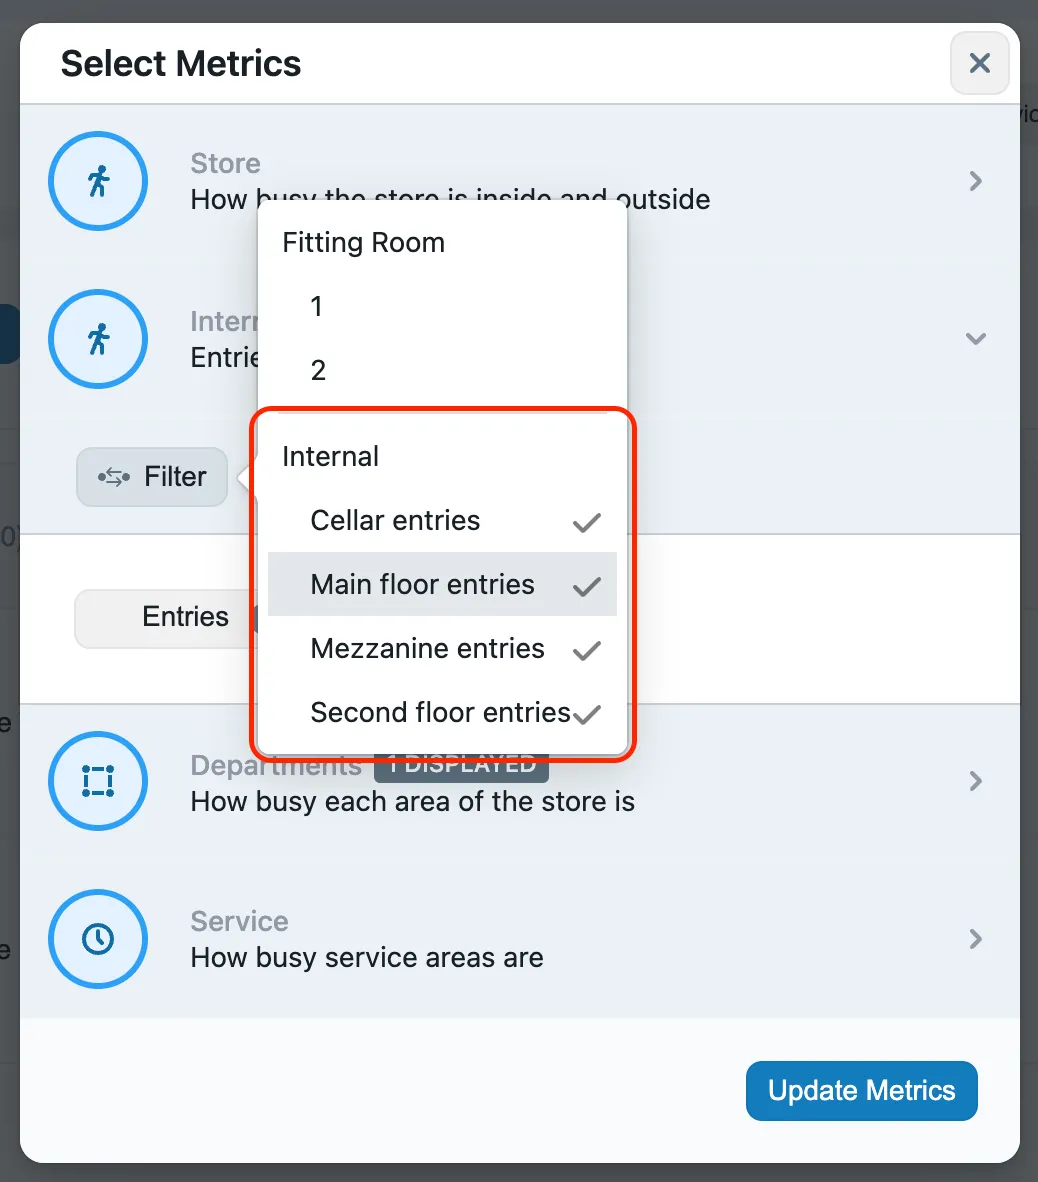
You can filter to each entrance in the Metrics menu and we can roll all entries across multiple entrances into a single 'Entries' count per store.
The below example shows where we have two entry points to a shop floor, one via the stairs and the other via the elevator. These are combined to create a total entry figure:
And in this example we can see multiple floors within the Internal Metrics view, allowing individual entry counts to be viewed for each floor:
#### Do you count entries to till points / service desks?
Yes. We also provide additional metrics here including queue sizes, in addition to segmenting staff and customer areas.
https://auravision.ai/knowledge/analytics/areas/what-about-till-points-service-desks
The green outline in the images below shows the areas we have defined behind and in front of the cash desk, allowing us to capture entries, dwell time, and queue metrics within these zones.
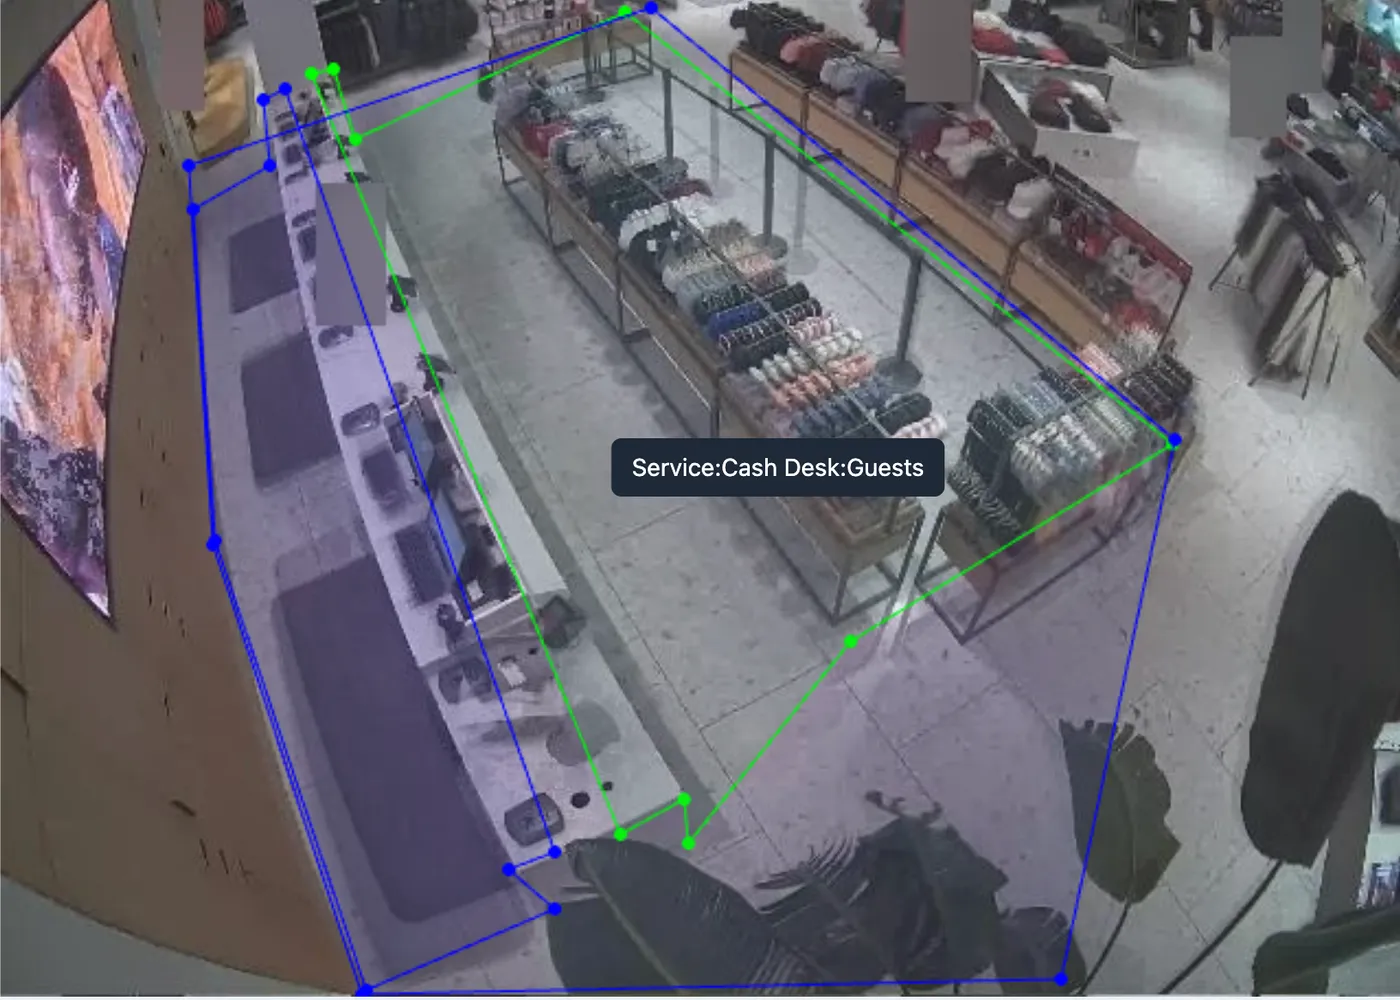
_Till / cash desk customer area_
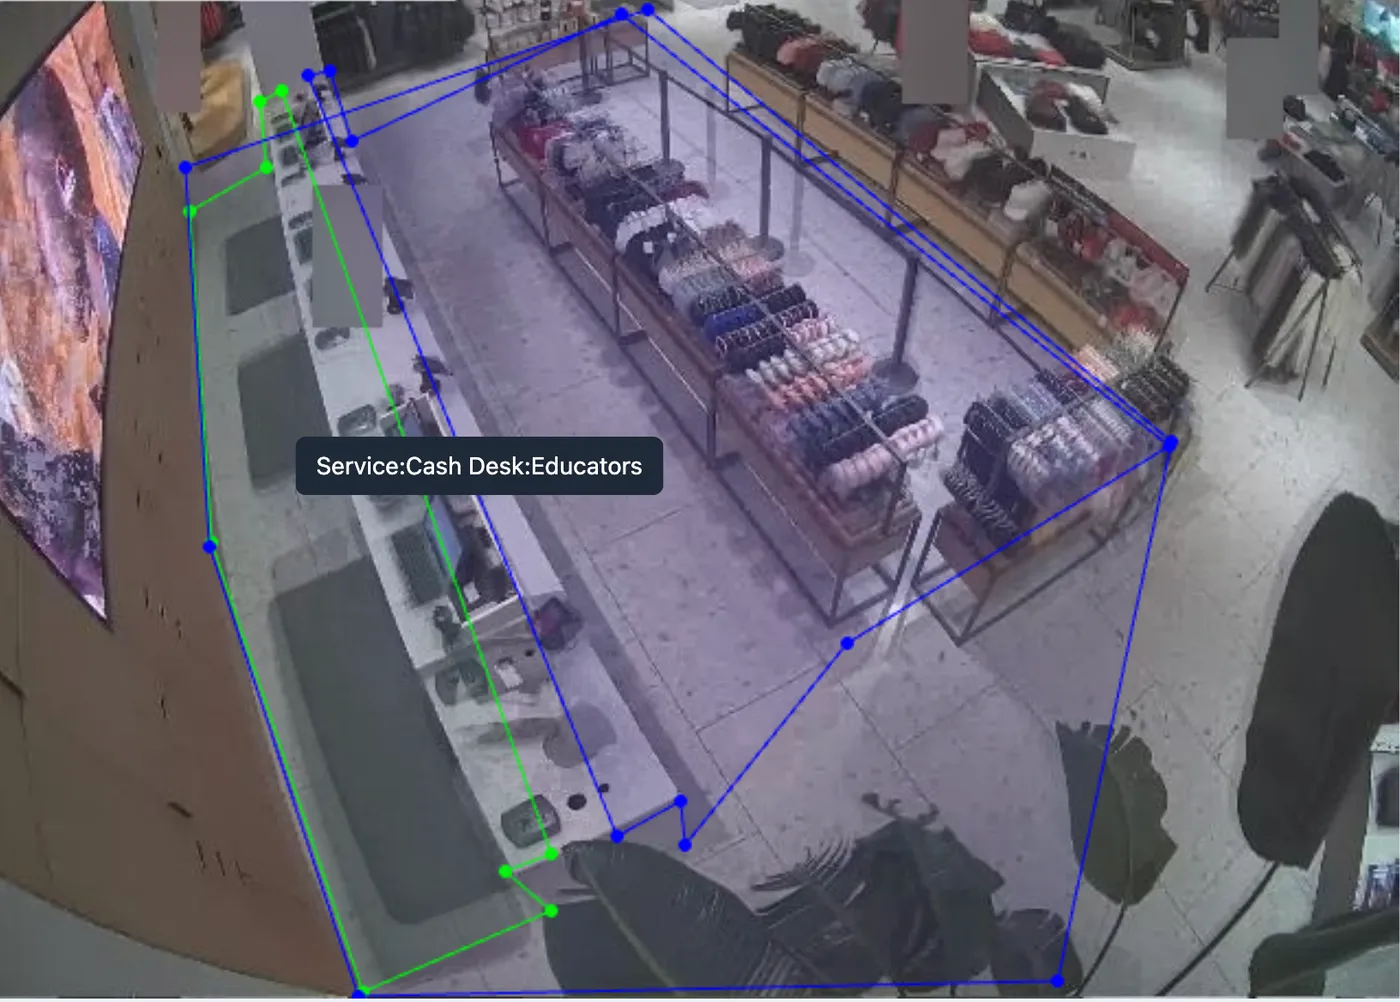
_Till / cash desk staff area_
#### Do you count entries to elevators / lifts / stairs / fitting rooms?
Yes — wherever a camera has a clear view of an internal entry point we can draw an entry line. Lifts, stairs and fitting rooms are common candidates for tracking inter-floor traffic and trial-room engagement.
https://auravision.ai/knowledge/analytics/footfall/what-about-elevators-lifts-stairs-fitting-rooms
Yes — wherever a camera has a clear view of an internal entry point, we can draw an entry line. Lifts, stairs, escalators and fitting rooms are common candidates.
## What you can measure
- **Stairs and escalators** — inter-floor traffic counts. Useful for multi-storey stores, shopping centres and transport hubs to see how customers move between levels.
- **Lifts** — entry counts in and out of the lift on each floor.
- **Fitting rooms** — visits per fitting-room cluster, dwell time per visit, demographic split of who's trying things on. A powerful proxy for purchase intent.
- **Internal department boundaries** — virtual gates between zones if you want to track flow rather than dwell.
## What's needed
A camera with line-of-sight on the entry point and a clear pedestrian path through the view. The 2-second rule applies just like at the main store entrance — quick passes through aren't counted.
## Example
The image below shows an entry line set up to count customers using the stairs and the lift into the shop floor:
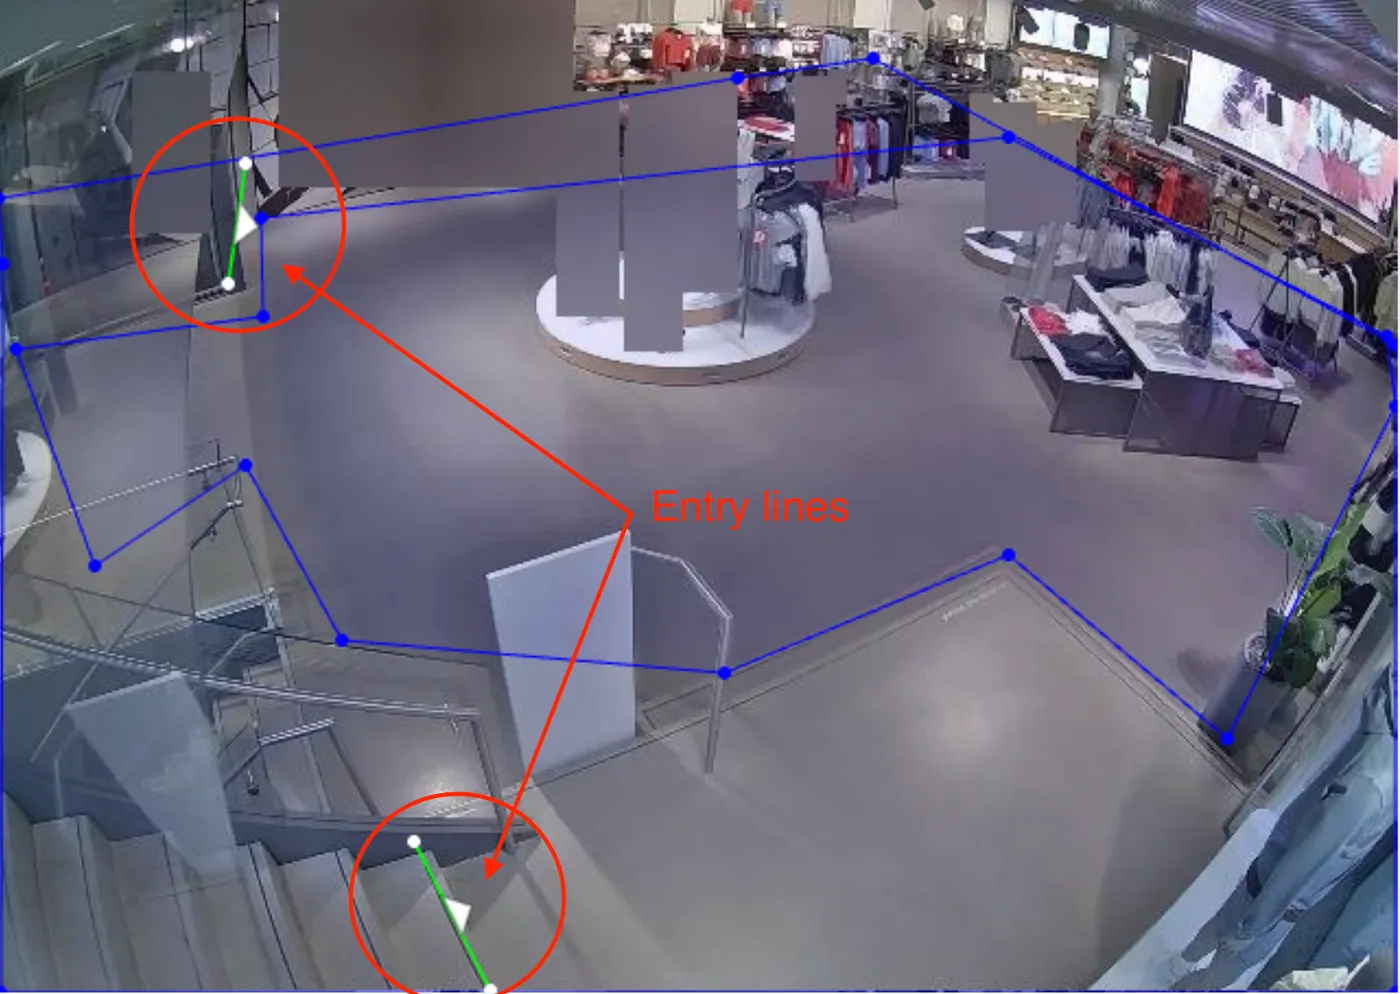
## How to add an internal entry line
If you want to add or change an internal entry line, get in touch at [support@auravision.ai](mailto:support@auravision.ai). Include the camera view and what you want measured; we'll confirm whether the angle works and add the line.
## Related
- [What is counted as a store entry / footfall?](/knowledge/analytics/footfall/entry-line)
- […
#### How is the accuracy of entry counts evaluated?
Aura Vision runs an accuracy audit on every location during setup, then randomised audits every quarter — each one a manual ground-truth comparison against video samples.
https://auravision.ai/knowledge/analytics/footfall/how-is-the-accuracy-of-entry-counts-evaluated
Aura Vision runs an accuracy audit on every location during setup, then randomised audits every quarter. Each audit is a manual ground-truth comparison: a human counts people in a sample of video clips and the result is compared to what the AI counted in the same period.
## What the audit checks
- **Entry-count accuracy** — does the AI's number match the ground-truth human count?
- **Staff vs. customer split** — is the AI correctly excluding employees?
- **Demographic accuracy** — does age and gender estimation match the human label?
The accuracy figure reported for your store comes directly from these audits.
## When an audit flags an issue
When an audit flags a count discrepancy, we work with you to resolve the cause — typically one of:
- **Obstructed view.** A product display or point-of-sale has moved into the camera's line of sight. The fix is moving the obstruction or repositioning the affected display.
- **Sub-optimal camera angle.** The current camera view doesn't fully cover the entrance pattern. The fix is switching to an alternative camera with better coverage.
- **Camera repositioned.** A camera has been moved since the last audit. We re-align the entry line and re-audit.
In most cases the fix is a small adjustment and accuracy is restored in days.
## Quarterly audits
Every store is randomly sampled for re-audit each quarter. The sample includes peak hours and off-peak hours so the result reflects accuracy under realistic conditions, not just quiet period…
#### How are areas mapped?
Areas are mapped by drawing polygonal shapes on the camera view during setup. Each shape becomes a tracked area — departments, checkouts, fitting rooms, service desks — and is fine-tuned against ground-truth audits.
https://auravision.ai/knowledge/analytics/areas/how-are-areas-mapped
Areas are mapped by drawing polygonal shapes on the camera view during setup. Each shape becomes a tracked area — *Footwear*, *Womenswear*, *Checkout*, *Fitting Rooms*, *Service Desk* — and the AI uses those boundaries to attribute every entry, dwell and demographic split.
## How the mapping is done
1. **Camera frames captured.** Our setup team takes a still from each connected camera covering the relevant floor space.
2. **Boundaries drawn.** Polygon shapes are placed on the still — usually one polygon per real-world area you want to measure. The polygon traces the floor, not the merchandise, so the area follows where customers stand.
3. **Sub-areas grouped.** Several polygons can roll up into a parent area. For example, *Menswear* might contain *Accessories*, *Footwear* and *Suits* — each independently tracked and summed up into a single department.
4. **Accuracy audit.** Once mapped, the team verifies counts against ground-truth video samples and adjusts the boundaries if needed.
## Examples of product areas
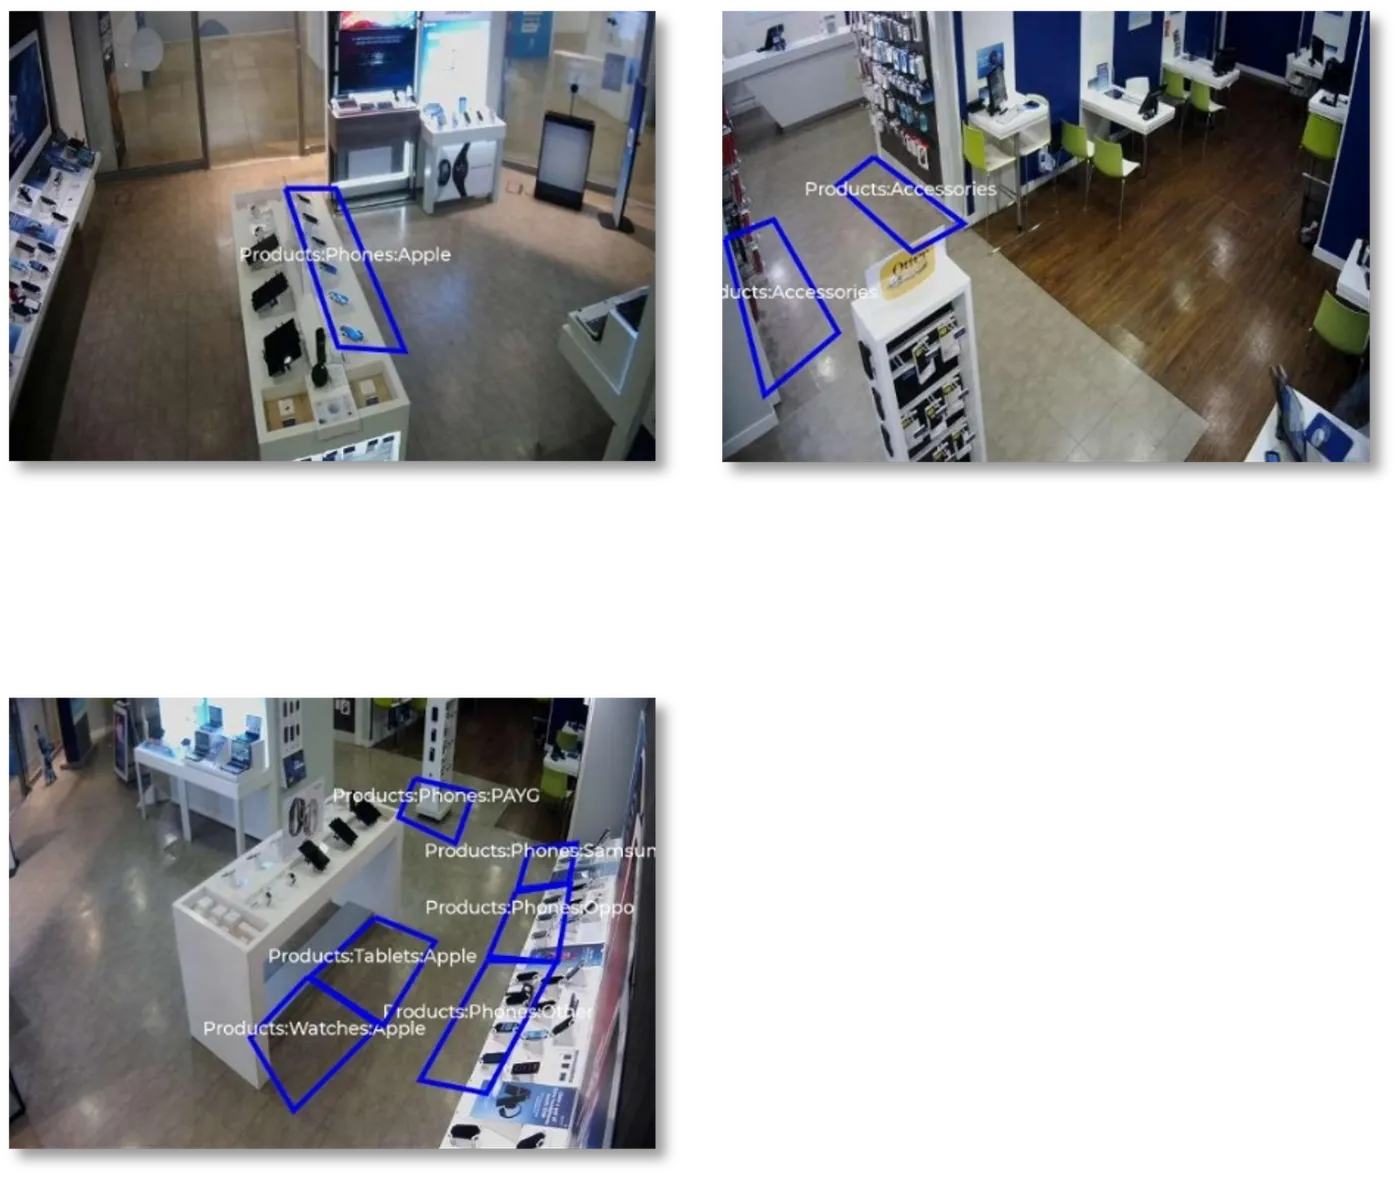
## When areas need re-mapping
- The store is refit and merchandise moves.
- A camera is repositioned (intentionally or after maintenance).
- New zones are added — a pop-up display, a seasonal department, a new fitting room cluster.
To request re-mapping, get in touch at [support@auravision.ai](mailto:support@auravision.ai) with a brief description of what's changed.
## Related
- [Is there a limit to t…
#### How does the system determine that a customer is within a zone?
Our algorithm determines a person's location by identifying the lowest visible point of their body.
https://auravision.ai/knowledge/analytics/areas/how-does-the-system-determine-that-a-customer-is-within-a-zone
If a person is fully visible in the zone, they will be counted there.
This is taken into account by our team when we are defining these areas.
#### How should areas be named?
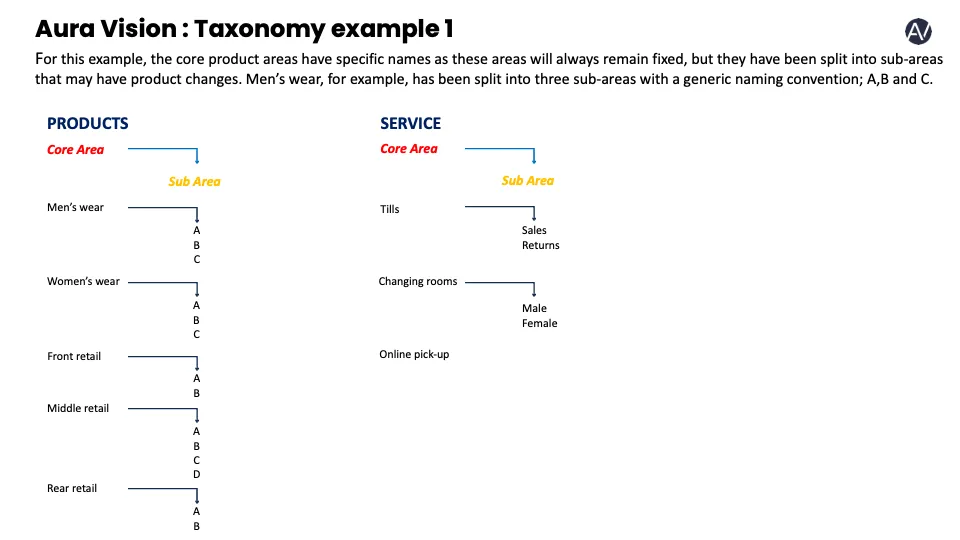
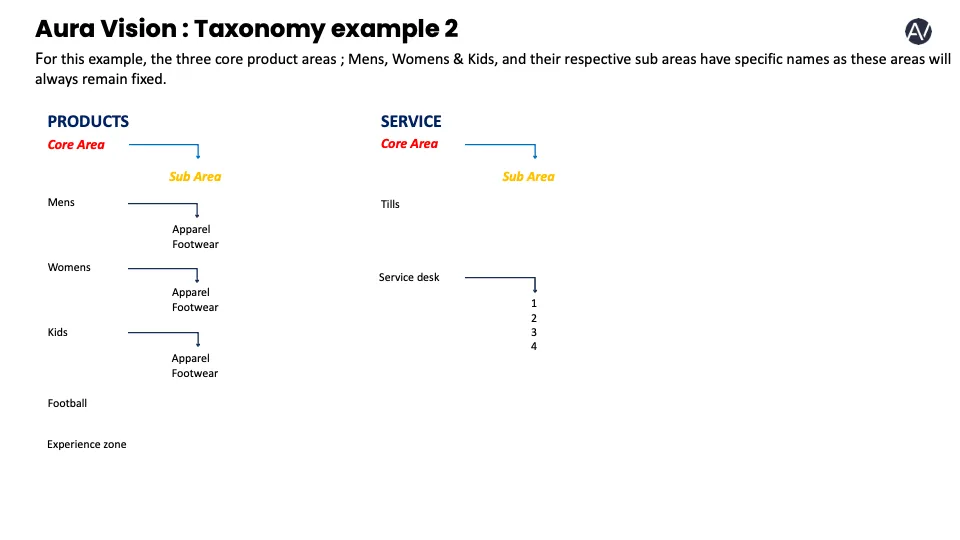
We recommend using generic Taxonomy (e.g. 'Product 1') instead of specific product names.
https://auravision.ai/knowledge/analytics/areas/how-are-areas-named
This helps maintain consistency and adaptability when there are frequent display changes.
It is best to avoid specific product names such as 'socks', 'swimwear' etc. if the product will regularly change throughout the year. This will ensure it is easier to make historical data comparisons.
It is possible to group several sub-areas under one core area. The Men's department, for example, may include accessories, boxers, shorts etc. as shown in this example. Selecting Men's will group all of the sub-area metrics.
We have included some examples below...
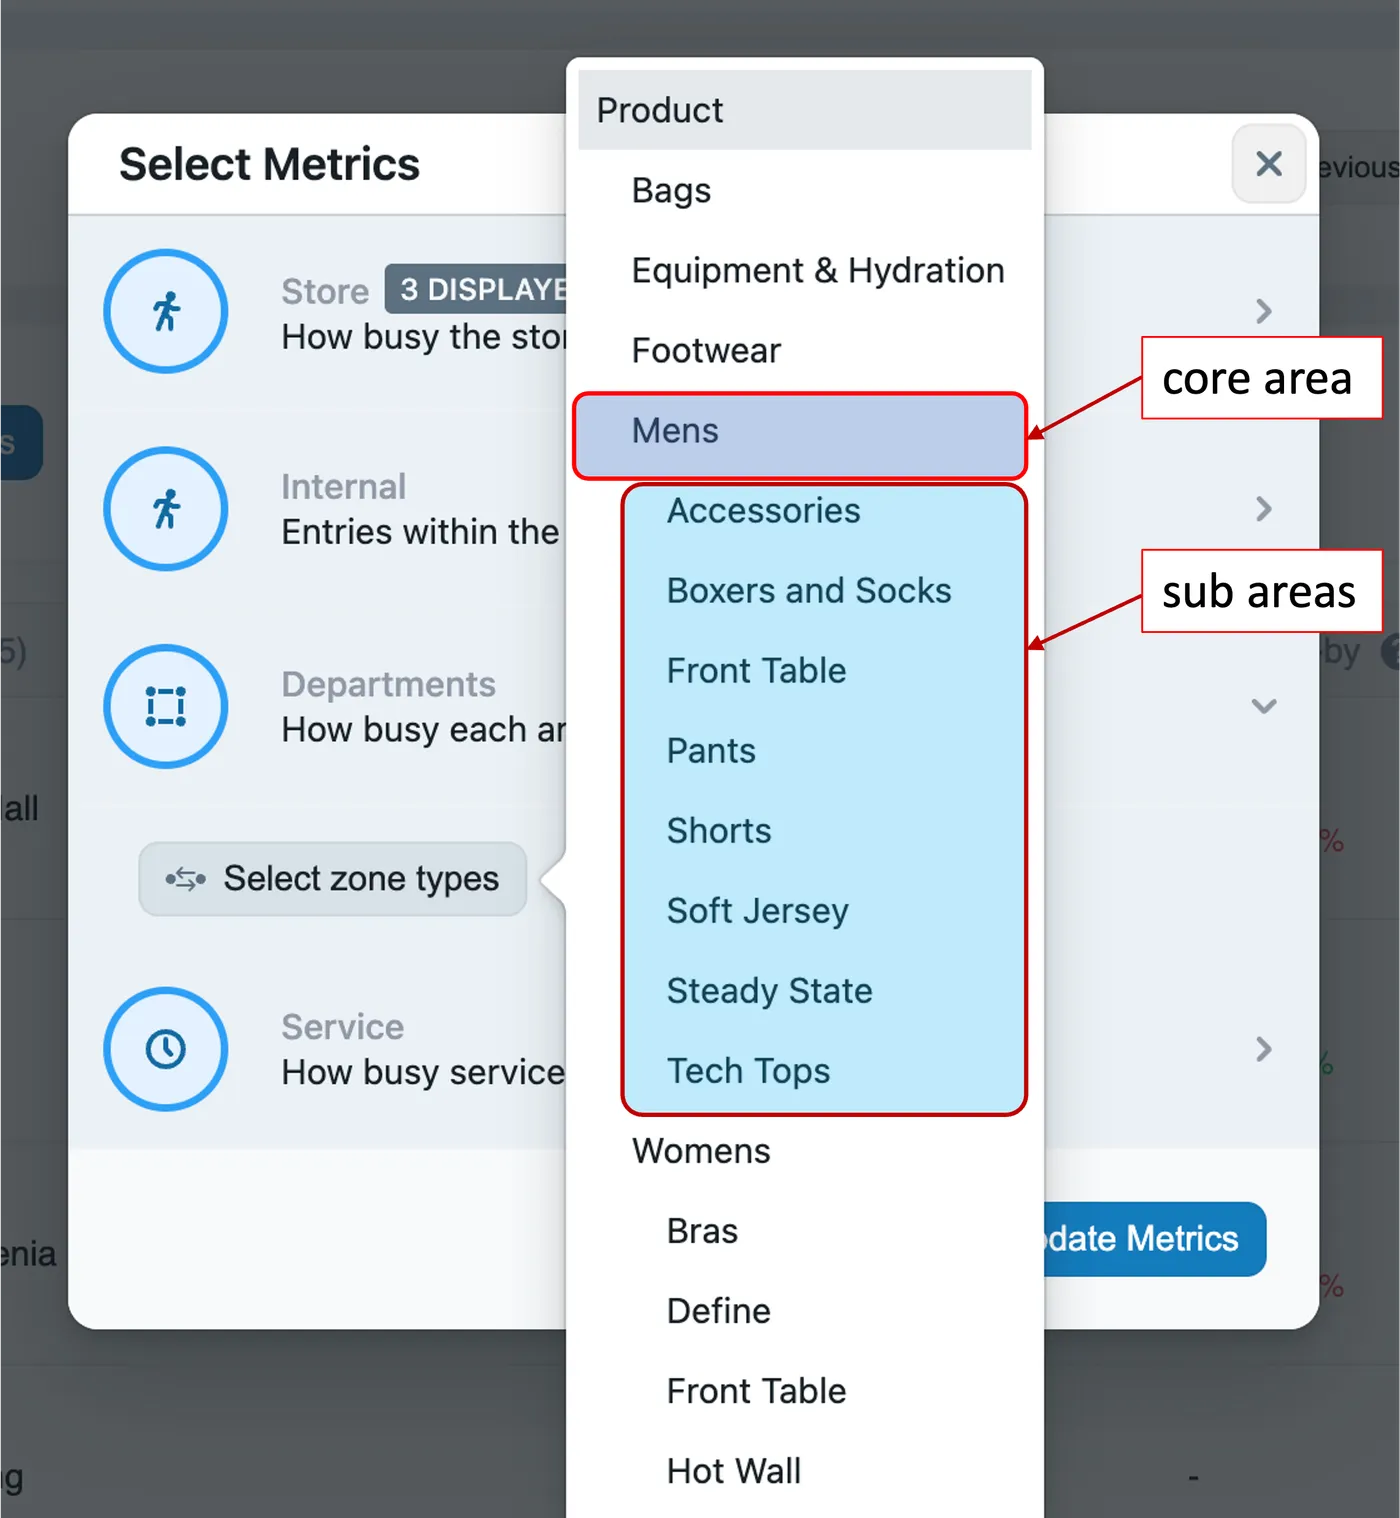
_An example of Taxonomy hierarchy in the Key Metrics view_
#### What is the smallest or largest area size we can have?
Dependent on the camera view, the smallest area is normally around 30–40 cm.
https://auravision.ai/knowledge/analytics/areas/what-is-the-smallest-or-largest-area-size-we-can-have
For larger areas we can combine views across multiple cameras into a single large area.
We can segment multiple areas but will always ensure that we optimise the areas so you're getting accurate data.
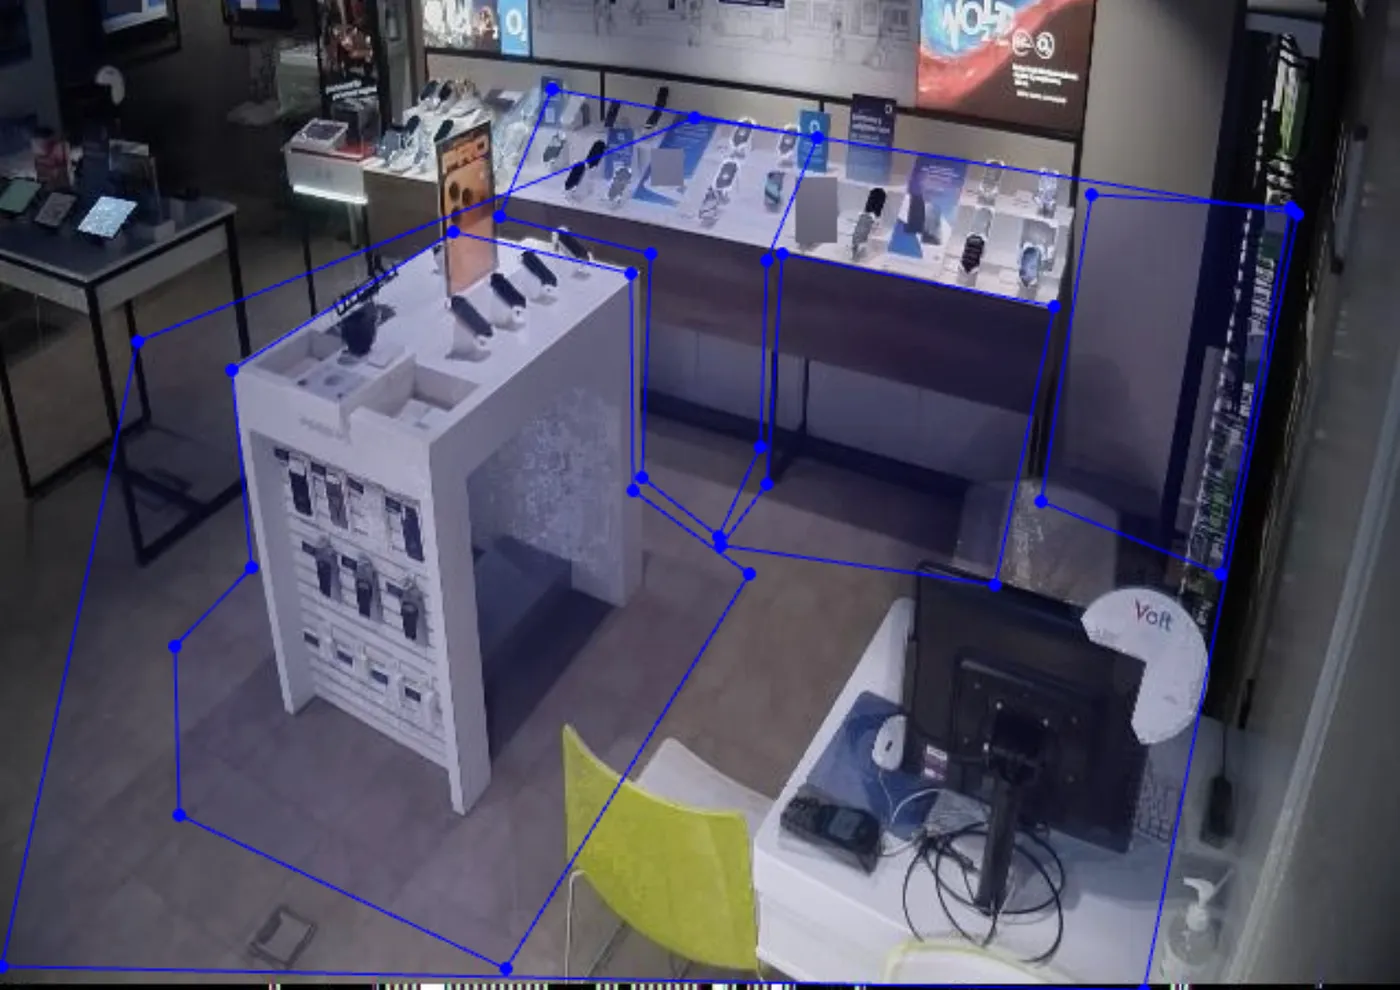
An example of multiple product areas (outlined in blue) within a single camera view is included below:
#### How can I check the areas for a store?
You have two options:
https://auravision.ai/knowledge/analytics/areas/how-can-i-check-the-areas-for-a-store
**1. Using Camera preview**
1. Select the camera preview from the dashboard menu and select a location from the drop-down field.
2. Click on the relevant thumbnail image.
3. Click on ‘Lines and Areas’ and you will now be able to see the image with the lines and areas included.
OR
**2. Previewing within Key Metrics and Explorer views**
You can check camera views, and the relevant zoning, when you are viewing metrics in the Key Metrics or Explorer views.
Simply hover over the camera icon next to the relevant metric, as shown below:
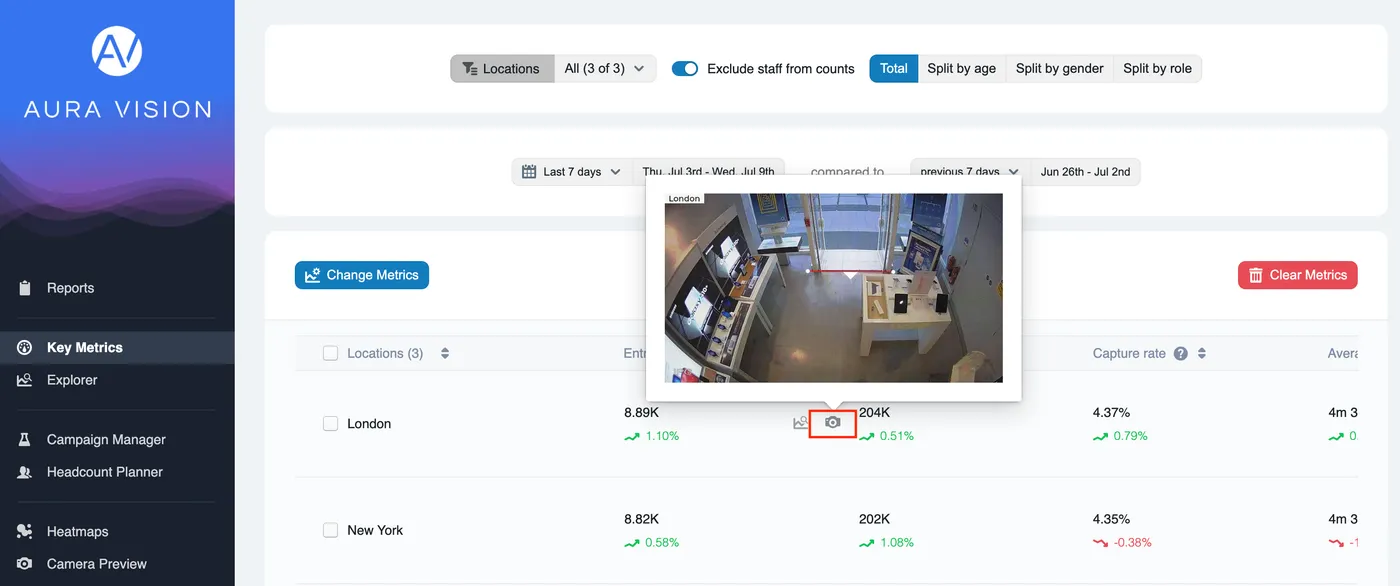
_Camera preview icon_
#### Does it count people who walk through an area?
Aura Vision only counts a visit to an area when someone stays inside it for 5 seconds or longer. People walking straight through aren't counted.
https://auravision.ai/knowledge/analytics/areas/does-it-count-people-who-walk-through-an-area
Aura Vision only counts a visit to an area when someone stays inside it for **5 seconds or longer**. People walking straight through aren't counted as having visited.
## Why the 5-second rule
The threshold filters out shoppers cutting across an area on their way somewhere else — a corridor passer-through, a customer moving past a display. Five seconds is long enough to indicate intentional dwell, short enough to capture a quick glance.
## What this means in practice
- **Entries**, **dwell time**, **occupancy** and **engagement** metrics for the area all use the 5-second rule.
- A shopper standing in front of a product display for 10 seconds: counted.
- The same shopper cutting across the area in 3 seconds: not counted.
If you need a different threshold for a specific area — for example a checkout zone where intent kicks in faster — get in touch at [support@auravision.ai](mailto:support@auravision.ai).
## Related
- [How are areas mapped?](/knowledge/analytics/areas/how-are-areas-mapped)
- [What is occupancy?](/knowledge/analytics/areas/occupancy)
#### Is there a limit to the number of areas I can have?
There's no hard limit on the number of areas you can configure. Most stores get the best signal from 5–15 well-chosen areas rather than dozens of small ones.
https://auravision.ai/knowledge/analytics/areas/is-there-a-limit-to-the-number-of-areas-i-can-have
There's no hard limit on the number of areas you can configure in a store. In practice, most stores get the best signal from **5–15 well-chosen areas** rather than dozens of small ones.
## Why fewer, larger areas usually work better
- Each area is a unit of analysis. Too many narrow zones fragment the data and make trends harder to spot.
- A camera view has limited resolution. Very small zones (single shelves, individual mannequins) are less reliable.
- Larger areas with logical grouping — *Footwear*, *Womenswear*, *Checkout*, *Fitting Rooms*, *Service Desk* — track meaningful behaviour and stay statistically stable across time.
## How to scope the right areas
During setup we'll review your store layout and camera coverage with you and recommend a configuration that balances **detail** (granular enough to act on) with **reliability** (large enough to count accurately).
If your store is being refit or you want to revisit the configuration later, get in touch at [support@auravision.ai](mailto:support@auravision.ai).
## Related
- [How are areas mapped?](/knowledge/analytics/areas/how-are-areas-mapped)
- [What is the smallest or largest area size we can have?](/knowledge/analytics/areas/what-is-the-smallest-or-largest-area-size-we-can-have)
#### Why is the Entry rate above 100% or 1.0X?
Multiple entries by the same person into an area are counted.
https://auravision.ai/knowledge/analytics/areas/why-is-the-entry-rate-above-100
High rates may reflect high engagement, or can indicate an opportunity to optimise the customer journey.
**Entry rate = Area entries / Store entries**
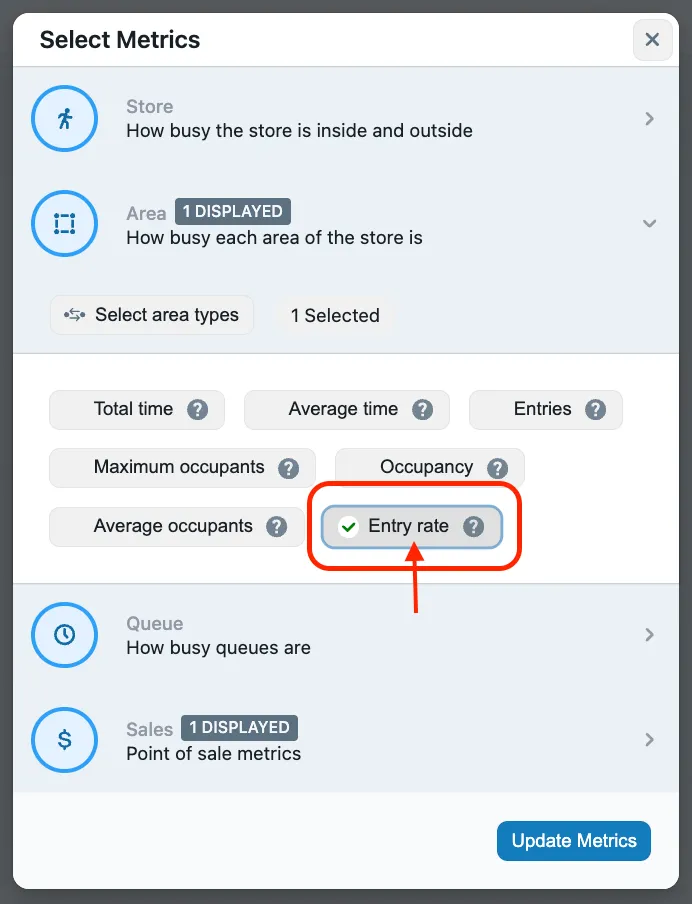
_Selecting Entry rate from the metrics selector panel_
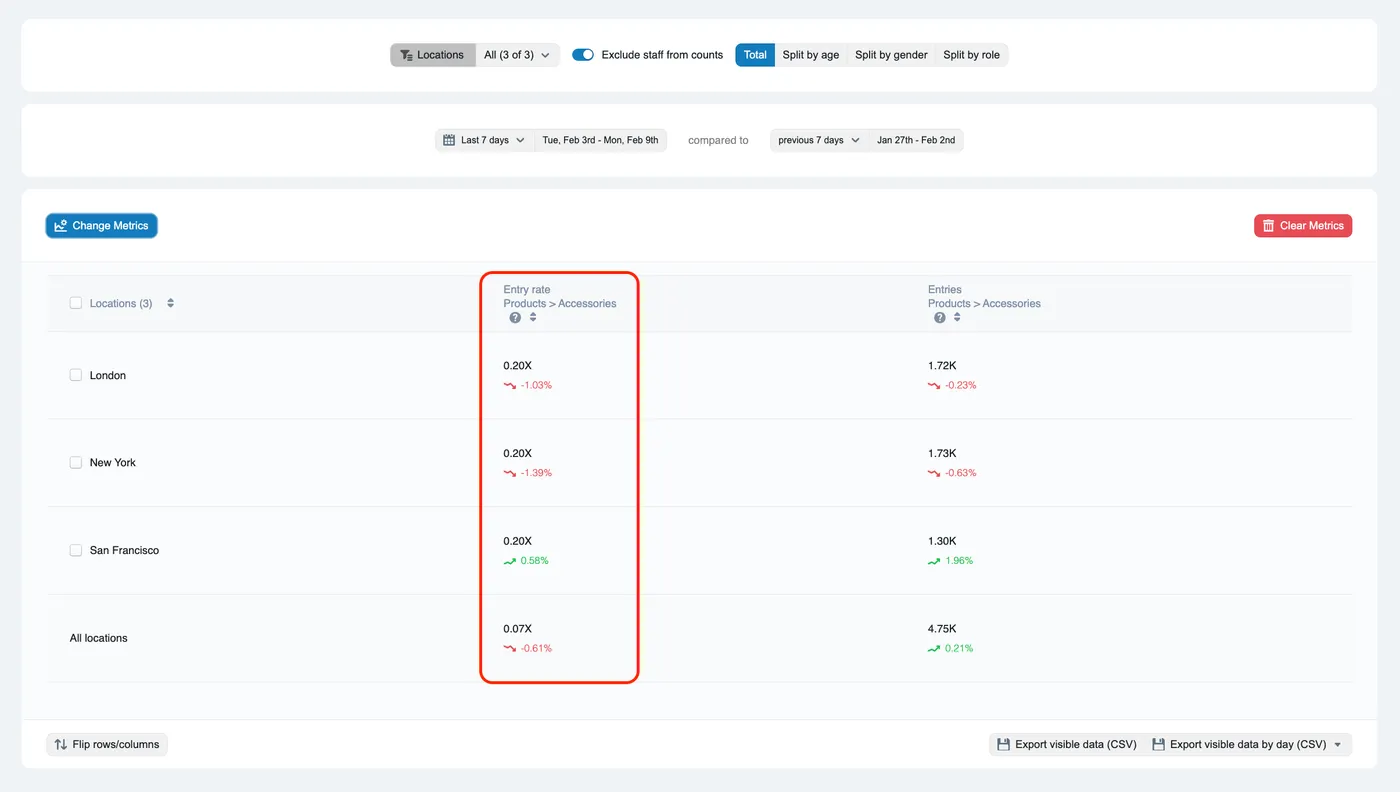
_Viewing the Entry rate metric in the 'Key metrics' view_
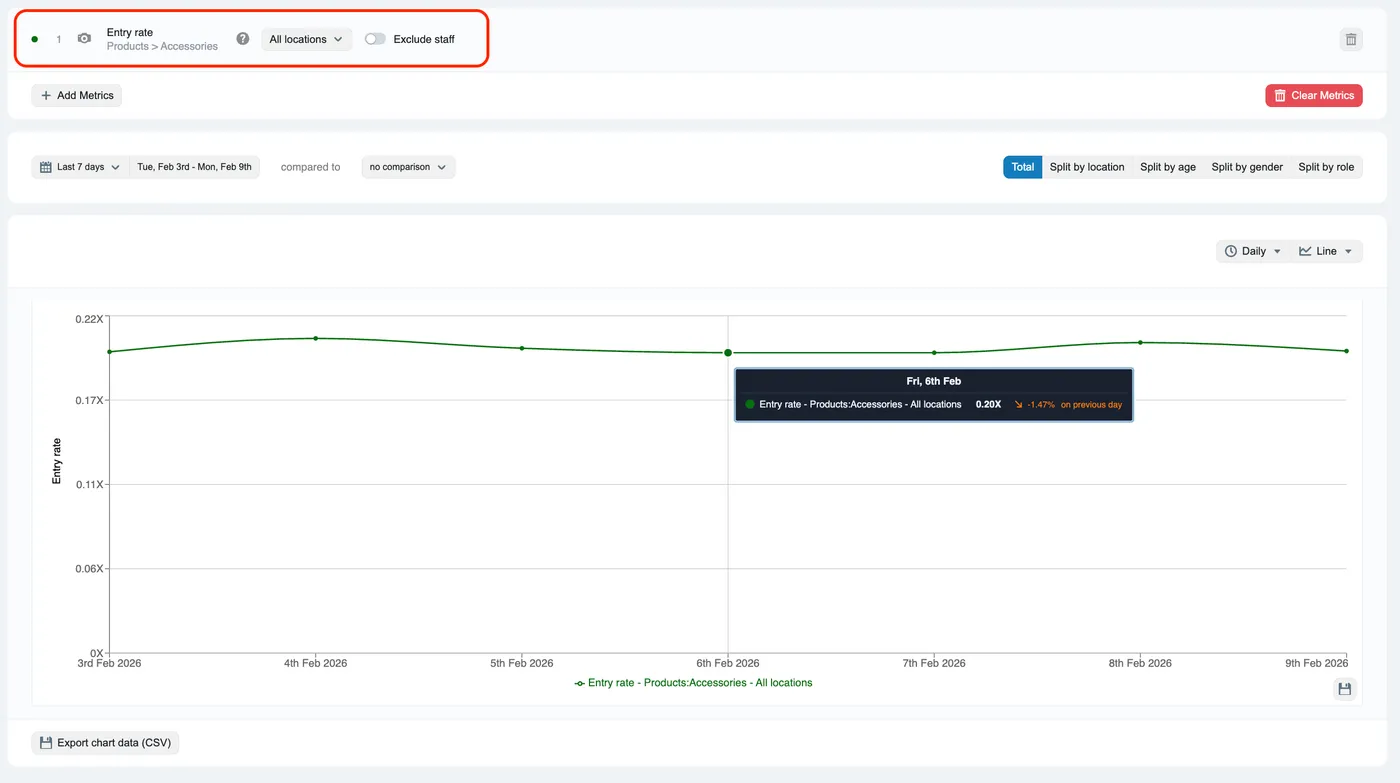
_Viewing the Entry rate metric in the 'Explorer' view_
#### Can I export a Heatmap?
It is possible to save the image, but if you need to download dwell time data, the best route is to use the Key Metrics or Explorer view where you can export...
https://auravision.ai/knowledge/analytics/heatmaps/can-i-export-a-heatmap
Please [refer to this article](#related-can-i-export-the-data) for guidance on how to view and export the data.
#### Do mannequins and TV screens affect Heatmaps?
No — mannequins, TV screens and any other persistent figure are excluded from heatmaps and people counts during setup, so they don't inflate dwell or movement signals.
https://auravision.ai/knowledge/analytics/heatmaps/do-mannequins-and-tv-screens-affect-heatmaps
No — mannequins, TV screens and any other persistent human-shaped figure are excluded from heatmaps and people counts. They're identified and masked during setup so they don't inflate dwell time or movement signals.
## How exclusion works
During the first week of setup, the AI is fine-tuned to your specific store layout. Persistent figures — mannequins on platforms, models on signage, people shown on display TVs — are marked as masked regions. Any time the model would otherwise detect them as a person, the detection is suppressed.
The mask sits at the location, not the figure — so if you move a mannequin during a refit, get in touch and we'll update the mask. Cameras are also re-audited periodically to catch new additions automatically.
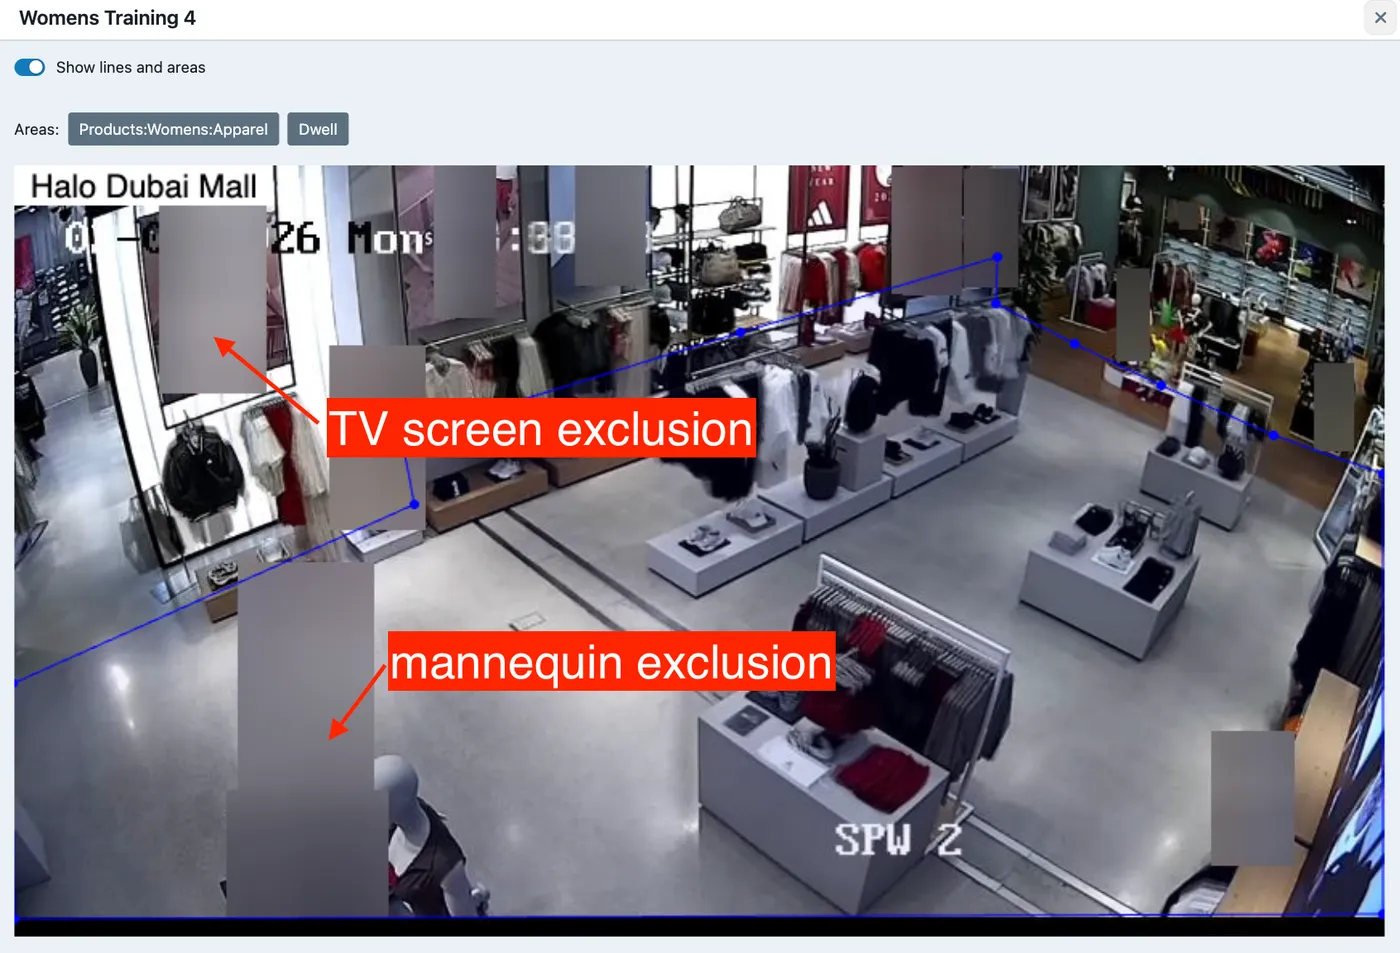
_Example of mannequin and TV screen exclusion_
## Why this matters
Without exclusion, a stationary mannequin would generate constant dwell at its location, creating a false hotspot on the Total Time heatmap. A TV screen showing a runway loop would do the same. The masking step keeps your heatmaps clean so the patterns you see reflect real customer behaviour.
## When to flag a change
- Window or in-store display refit moves mannequins to new positions.
- New display TVs are installed.
- Permanent signage with human figures is added.
Email [support@auravision.ai](mailto:support@auravision.ai) with a quick description and the camera view, and the masks a…
#### How does it recognise age and gender?
We use an AI-powered algorithm that has been trained on massive datasets.
https://auravision.ai/knowledge/analytics/demographics/how-does-it-recognise-age-and-gender
It looks at multiple characteristics including body shape and clothing, and has passed extensive accuracy tests.
#### How does it recognise staff?
We train the algorithm to recognise a visually distinct cue such as staff uniform or a lanyard using images provided by you.
https://auravision.ai/knowledge/analytics/demographics/how-does-it-recognise-staff
Lanyards work best when there is a clear contrast between the lanyard and the clothing. A white lanyard on a white shirt is difficult to distinguish, for example.
Here are some examples where we achieve high accuracy in staff segmentation:

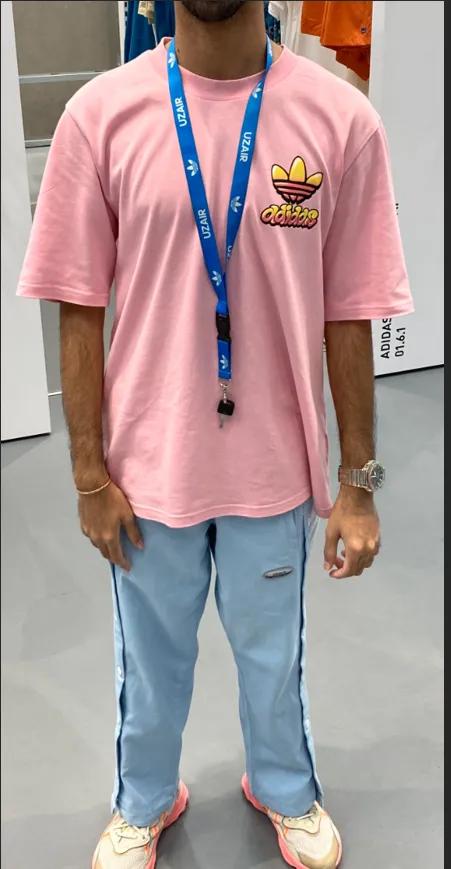
#### How accurate is gender recognition?
Gender recognition is 95% accurate on average across male and female categories, measured against ground-truth audits at deployment.
https://auravision.ai/knowledge/analytics/demographics/how-accurate-is-gender-recognition
Gender recognition is **95% accurate on average** across male and female categories, measured against ground-truth audits at deployment.
## How accuracy is measured
For each store, our team samples anonymous face-blurred snapshots from the cameras during the first week of operation and manually verifies the AI's gender estimate against a human label. The resulting accuracy figure is what we report and what your dashboard reflects.
## What the 95% number includes
- It's an aggregate across all stores, all camera angles, and both gender categories.
- Per-store accuracy can vary slightly based on camera placement, lighting and demographic mix.
- The figure refers to estimation accuracy — Aura Vision does not identify individuals, only counts an anonymous estimated gender per visit.
## When accuracy is lower than the average
Stores with steep camera angles, very low light, or short-dwell entrance views can see lower numbers. In those cases we'll work with you during setup to reposition the camera view or use an alternative angle.
## Related
- [How accurate is age recognition?](/knowledge/analytics/demographics/how-accurate-is-age-recognition)
- [How does it recognise age and gender?](/knowledge/analytics/demographics/how-does-it-recognise-age-and-gender)
#### How accurate is Age recognition?
Age recognition is 85–90% accurate across seven age bands, measured against ground-truth audits at deployment.
https://auravision.ai/knowledge/analytics/demographics/how-accurate-is-age-recognition
Age recognition is **85–90% accurate** across seven age bands, measured against ground-truth audits at deployment.
## How the bands are structured
Age estimates fall into one of seven categories:
1. Under 16
2. 16–24
3. 25–34
4. 35–44
5. 45–54
6. 55–64
7. 65+
Bands are wider than precise birthdays for a reason: estimating exact age from a single video frame isn't possible, but classifying into a 10-year band is reliable, useful, and privacy-friendly.
## How accuracy is measured
For each store, the setup team samples anonymous face-blurred snapshots from the cameras during the first week of operation and manually labels each one with a human-estimated age band. The AI's estimate is compared to the human label and the resulting accuracy figure is what your dashboard reflects.
## When accuracy is lower than the average
Stores with steep camera angles, very low light, or short-dwell entrance views can see slightly lower numbers. In those cases the setup team will reposition the camera view or switch to an alternative angle during tuning.
## Related
- [How accurate is gender recognition?](/knowledge/analytics/demographics/how-accurate-is-gender-recognition)
- [How does it recognise age and gender?](/knowledge/analytics/demographics/how-does-it-recognise-age-and-gender)
- [Does it count infants?](/knowledge/analytics/demographics/does-it-count-infants)
#### How accurate is Staff recognition?
Staff recognition is 99% accurate when employees wear the distinctive visual cue the AI was trained on — typically a branded uniform, polo, apron or lanyard.
https://auravision.ai/knowledge/analytics/demographics/how-accurate-is-staff-recognition
Staff recognition is **99% accurate** when employees wear the distinctive visual cue the AI was trained on — typically a branded uniform, polo, apron, or lanyard.
## What "the trained cue" means
During setup, the AI is fine-tuned on samples of your team wearing whatever distinctive item identifies them as staff. From that point on, anyone in the camera view wearing that cue is recognised as staff and excluded from customer footfall, conversion and dwell metrics.
## When accuracy is lower than 99%
The figure depends on the cue actually being worn:
- **Casual Friday / out-of-uniform shifts** — staff members in plain clothes won't be recognised that day.
- **Uniform redesign** — when the visual cue changes, the AI needs a re-tune on the new cue before accuracy returns to baseline.
- **Visiting head-office or third-party staff** — anyone not wearing your team's cue counts as a customer.
In each case, get in touch at [support@auravision.ai](mailto:support@auravision.ai) and the team will arrange a re-tune.
## Related
- [How does it recognise staff?](#related-how-does-it-recognise-staff)
- [How accurate is gender recognition?](/knowledge/analytics/demographics/how-accurate-is-gender-recognition)
- [How accurate is Age recognition?](/knowledge/analytics/demographics/how-accurate-is-age-recognition)
#### Does it count infants?
Infants are counted in the Under 16 demographic group. Aura Vision groups all under-16s together rather than estimating an exact age for children.
https://auravision.ai/knowledge/analytics/demographics/does-it-count-infants
Infants are counted in the **Under 16** demographic group. Aura Vision groups all under-16s together rather than estimating an exact age for children.
## Why a single Under 16 bucket
Age estimation for children is intentionally coarser than for adults. Aggregating into a single Under 16 group:
- Keeps reporting privacy-friendly (no identification or age estimation of individual minors).
- Reflects what a retailer can act on: family-shopping signal is more useful than guessing whether a child is 4 or 8.
- Stays robust as children develop physically at different rates.
## In the dashboard
The Under 16 group sits alongside the adult age bands (16–24, 25–34, 35–44, 45–54, 55–64, 65+) in every demographic breakdown — footfall, dwell, area entries and conversion all support the split.
If your reporting needs to suppress the Under 16 group entirely for a specific use case, get in touch at [support@auravision.ai](mailto:support@auravision.ai).
## Related
- [How does it recognise age and gender?](/knowledge/analytics/demographics/how-does-it-recognise-age-and-gender)
- [How accurate is age recognition?](/knowledge/analytics/demographics/how-accurate-is-age-recognition)
#### Can we choose custom age groups?
The age group segmentation has been trained on massive data sets and these cannot be amended.
https://auravision.ai/knowledge/analytics/demographics/can-we-choose-custom-age-groups
You can filter age groups to the following categories:
1. Under 16
2. 16–24
3. 25–34
4. 35–44
5. 45–54
6. 55–64
7. 65 and over
#### Can I remove an age-group category?
Yes, it is possible to remove a single age group category. We could, for example, remove the under-16 age group category.
https://auravision.ai/knowledge/analytics/demographics/can-i-remove-an-age-group-category
Please speak to your account manager and we'll work with you to action this.
#### Are there any measures in place to ensure demographic estimates are not biased or discriminatory?
Aura Vision starts with a trained generic AI model that is fine-tuned per store to improve accuracy and reduce bias.
https://auravision.ai/knowledge/analytics/demographics/are-there-any-measures-in-place-to-ensure-demographic-estimates-are-not-biased
All data is fully anonymised and aggregated to protect privacy.
Models are regularly reviewed and re-trained if accuracy drops.
The system follows strict GDPR and ethical standards to prevent discrimination.
#### Can demographics be switched on for individual stores or groups of stores?
Yes. Demographics default to an organisation-wide setting, but stores can be split into groups with different demographic configurations if needed.
https://auravision.ai/knowledge/analytics/demographics/can-demographics-be-switched-on-for-individual-stores
Yes. Demographics default to an organisation-wide setting, but stores can be split into groups with different demographic configurations if you need it. For example, the team might want age and gender enabled across the full estate but suppress demographic capture entirely in one regulated location, or run a different age-band split in a flagship store.
## How the split works
- Stores are organised into **groups** in the dashboard.
- Each group can independently enable, disable, or re-shape its demographic capture.
- Reporting at the organisation level rolls up across all groups; reporting at the group level reflects that group's settings.
## How to request a change
Get in touch at [support@auravision.ai](mailto:support@auravision.ai) with the stores and the change you want. The team will set up the groups and confirm what's reflected in the dashboard before any change takes effect.
## Related
- [How does it recognise age and gender?](/knowledge/analytics/demographics/how-does-it-recognise-age-and-gender)
- [How accurate is gender recognition?](/knowledge/analytics/demographics/how-accurate-is-gender-recognition)
- [Does it count infants?](/knowledge/analytics/demographics/does-it-count-infants)
#### What do the numbers in the coloured grid indicate?
Each number is a staffing hour. A number 4, for example, would indicate 4 staffing hours (4 people) are required for that hourly slot.
https://auravision.ai/knowledge/analytics/headcount/what-do-the-numbers-in-the-coloured-grid-indicate
The distribution of these numbers is based on the total staffing hours you have entered, and historical footfall data.
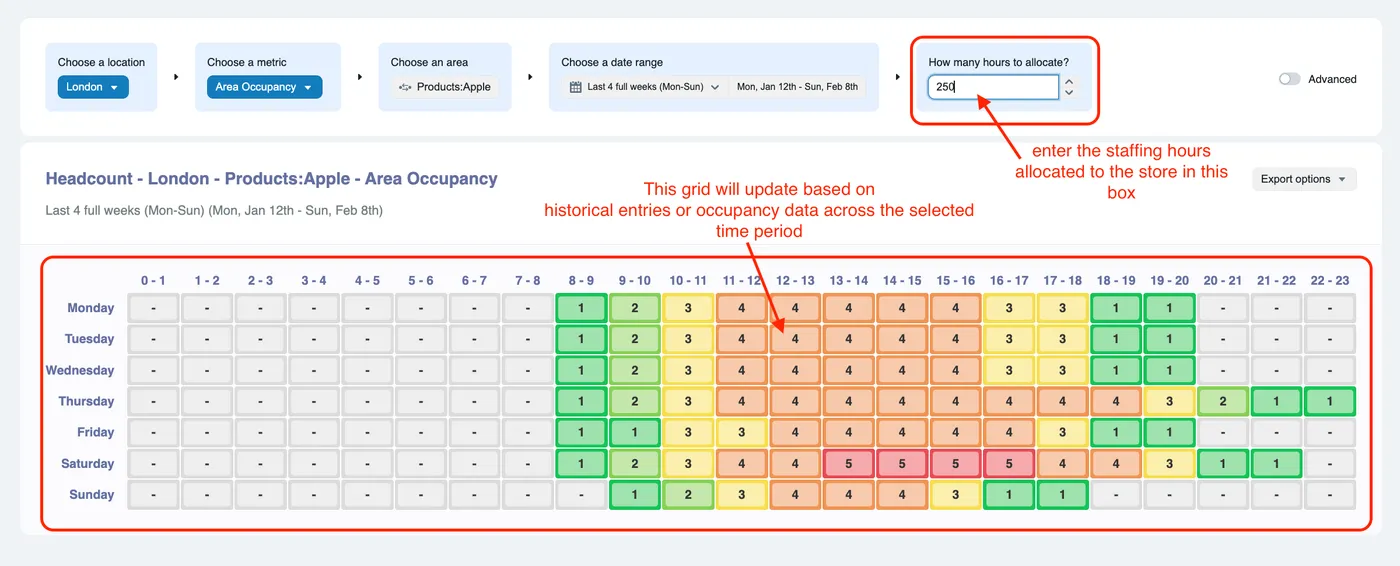
For a walkthrough example of using the Headcount planner to optimise staff schedules, see [How to optimise staff schedules to meet customer demand](/knowledge/tutorials/how-to-optimise-staff-schedules-to-meet-customer-demand).
#### Do you ingest sales data?
Yes — sales data can be ingested into Aura Vision and shown alongside footfall, dwell and demographics so you can measure conversion rate directly in the dashboard.
https://auravision.ai/knowledge/analytics/conversion/do-you-ingest-sales-data
Yes — Aura Vision can ingest sales data and display it in the dashboard alongside footfall, dwell, and demographics. The most common use case is **conversion rate** at the store, hour, day or campaign level.
## What we can ingest
- Transaction counts per store, per day or per hour.
- Transaction values (basket totals) for ATV (Average Transaction Value) analysis.
- Item-level or category-level sales for product-area attribution.
- Aggregated demographic-split sales if your POS captures customer segment.
## How the data gets in
Three common patterns:
- **Daily CSV upload** — for retailers with no live POS integration.
- **Scheduled SFTP push** — overnight transfers from your data warehouse.
- **Live API integration** — your POS or ETL pipeline writes to the Aura Vision API.
The team will scope the right approach with your data engineering or POS contact during setup.
## What you get in the dashboard
Once sales data is connected, the Metrics view exposes **conversion rate**, **sales per visitor**, **ATV trends**, and **demographic split by purchase**. Sales also appear in the Headcount planning view so staff schedules can be measured against revenue impact.
To scope a sales integration, get in touch at [support@auravision.ai](mailto:support@auravision.ai).
## Related
- [Can we integrate with your API?](/knowledge/setup/integrations/can-we-integrate-with-your-api)
- [How is Conversion rate calculated?](/knowledge/analytics/conversion/conversion-rate)
### Setup
#### APU (Analytics Processing Unit)
The APU is the small on-premise edge computer that runs Aura Vision's AI inside the store, so full-resolution video never leaves the building. About the size of a paperback book, it connects to the existing camera network on one side and the store's internet on the other.
https://auravision.ai/knowledge/setup/installation/apu
**APU** is the small on-premise computer that runs the AI for an Aura Vision installation. Roughly the size of a paperback book, it sits in the back office and processes every camera frame locally — so full-resolution video never leaves the store. Only anonymised, aggregated counts are sent to the cloud, at under 50 Kb/s per camera.
## Where it sits
The APU plugs into the same network as the existing CCTV cameras — typically the camera switch, NVR or DVR — and into the store's internet connection. No new cameras, no new cabling.
## How it scales
Each APU handles up to nine cameras. Larger sites — flagship stores, multi-floor layouts — use multiple APUs on the same network, each processing its own slice of cameras.
## Related
- [How does the APU connect to our cameras and internet?](/knowledge/setup/installation/how-does-the-micro-pc-connect-to-our-cameras-and-internet)
- [How many cameras can be connected?](/knowledge/setup/installation/how-many-cameras-can-be-connected)
- [How does Aura Vision work?](/knowledge/getting-started/how-does-it-work)
#### API
The API is Aura Vision's programmatic interface for pulling analytics into your own systems, exposing both a REST API for resources and a WebSocket API for metrics.
https://auravision.ai/knowledge/setup/integrations/api
**The API** is Aura Vision's programmatic interface for pulling analytics into your own systems, exposing both a REST API for resources and a WebSocket API for metrics. Everything visible in the dashboard is available through the API at the same 15-minute granularity.
## What's available
- **Core REST API** at `https://api.auravisionlabs.com/v1` — locations, recordings, campaigns, uptime and device status.
- **Metrics WebSocket API** at `wss://ws.auravision.ai` — footfall, dwell, occupancy, area utilisation, demographic breakdowns, transaction conversion, sales metrics, heatmaps and exports.
Both interfaces support 15-minute granularity through to hourly, daily, weekly and monthly aggregates.
## In practice
Common uses include feeding footfall, conversion and demographics into BI tools and data warehouses such as Snowflake, BigQuery, Looker or Power BI; powering workforce-management systems with customer-demand patterns; and surfacing store-level KPIs in internal dashboards or mobile apps.
## Related
- [Can we integrate with your API?](/knowledge/setup/integrations/can-we-integrate-with-your-api)
#### Camera
A camera, in Aura Vision, is one of the existing IP / RTSP / ONVIF CCTV cameras already installed in the store and connected to the APU. Aura Vision doesn't ship cameras — it uses the views already on the network.
https://auravision.ai/knowledge/setup/installation/camera
**Camera** refers to one of the existing IP, RTSP or ONVIF CCTV cameras already installed in the store. Aura Vision doesn't ship or install cameras — it connects to the views already on the store's camera network via the APU. Compatibility covers roughly 98% of cameras on the market.
## What different cameras do
Each connected camera plays a specific role in the analytics:
- **Entrance cameras** — feed the footfall count, capture rate and passer-by metrics via the entry line.
- **Area / floor cameras** — cover departments, aisles and zones for dwell, traffic and demographic splits.
- **Service-desk and queue cameras** — power queue length, wait time and staff-interaction metrics.
Cameras pointing at stockrooms, offices or other back-of-house spaces are not connected — they have no business signal and raise unnecessary privacy questions.
## Related
- [What type of cameras do we need to have?](/knowledge/setup/installation/what-type-of-cameras-do-we-need-to-have)
- [Do you use all of the CCTV camera views?](/knowledge/setup/installation/do-you-use-all-of-the-cctv-camera-views)
- [Can you add more cameras?](/knowledge/setup/installation/can-you-add-more-cameras)
#### SSO (Single Sign-On)
SSO (Single Sign-On) is the mechanism that lets your team sign in to the Aura Vision dashboard using your organisation's existing identity provider, rather than maintaining a separate set of credentials.
https://auravision.ai/knowledge/setup/integrations/sso
**SSO (Single Sign-On)** is the mechanism that lets your team sign in to the Aura Vision dashboard using your organisation's existing identity provider, rather than maintaining a separate set of credentials. Aura Vision integrates with any SAML 2.0 or OIDC-compliant IdP.
## Supported providers
- Okta
- Microsoft Entra ID (formerly Azure AD)
- Google Workspace
- OneLogin
- JumpCloud
- Auth0
- LDAP-backed providers
## What it enables
MFA policies and password rules you already enforce in your IdP apply automatically when staff sign in to Aura Vision. IdP groups can be mapped to Aura Vision roles — admin, analyst, store manager, viewer — so permissions stay in sync as people join, move or leave the organisation. Provisioning and de-provisioning is centralised in your IdP, which removes a class of orphaned-account risk.
## Related
- [Do you provide SSO integration?](/knowledge/setup/integrations/do-you-provide-sso-integration)
#### Ground-truth audit
A ground-truth audit is the manual verification process used to confirm Aura Vision's accuracy: a human counts people in a sample of video clips and the result is compared against the AI's count for the same period.
https://auravision.ai/knowledge/setup/installation/ground-truth-audit
**Ground-truth audit** is the manual verification process used to confirm Aura Vision's accuracy. A human counts people in a sample of video clips from a store's cameras, and the result is compared against the AI's count for the same period. The accuracy figure reported for each store comes directly from these audits.
## When audits happen
- **At go-live.** Every store is audited against ground truth during initial setup, before the data is signed off.
- **Quarterly thereafter.** A random sample of stores is re-audited every quarter to catch model drift from lighting changes, seasonal layouts, refits or new uniforms. Samples include both peak and off-peak hours.
## What's checked
Audits cover entry-count accuracy, the staff-versus-customer split and demographic estimation. When a discrepancy is found — usually an obstructed view, a sub-optimal angle or a repositioned camera — the fix is typically a small adjustment and accuracy is restored within days.
## Related
- [How is the accuracy of entry counts evaluated?](/knowledge/analytics/footfall/how-is-the-accuracy-of-entry-counts-evaluated)
- [What happens if we move a camera?](/knowledge/setup/installation/what-happens-if-we-move-a-camera)
#### What happens if we move a camera?
Please inform us if a camera is changed or moved as we will need to re-align the lines and areas.
https://auravision.ai/knowledge/setup/installation/what-happens-if-we-move-a-camera
If an entrance camera is moved, we will also have to complete new audits to ensure the accuracy meets our standards.
#### How many cameras can be connected?
Enhanced Footfall typically uses 1 camera per store.
https://auravision.ai/knowledge/setup/installation/how-many-cameras-can-be-connected
Full-store Analytics connects up to 9 cameras per APU.
Larger setups will require additional APU devices.
#### Do you use all of the CCTV camera views?
Aura Vision connects only to the cameras with clear views of entrances and areas you want to measure. Cameras pointing at back-of-house, stockrooms or staff-only zones aren't connected.
https://auravision.ai/knowledge/setup/installation/do-you-use-all-of-the-cctv-camera-views
Aura Vision connects only to the cameras with clear views of entrances and the areas you want to measure. Cameras pointing at back-of-house, stockrooms or staff-only zones aren't connected.
## How camera selection works
During setup our team reviews the store's camera layout with your IT or operations contact and selects the minimum viable set:
- **Entrance cameras** — for footfall, passer-by counting and capture rate.
- **Floor cameras** — covering each area you want to measure (departments, fitting rooms, checkout, queues).
- **Staff-area cameras** — only if you want to track service interactions or staff-customer ratios in those zones.
## Cameras we won't connect to
- Stockrooms, offices, server rooms, staff break rooms — no business signal, and connecting them creates unnecessary privacy questions.
- Outward-facing security cameras for boundary surveillance — these aren't part of the analytics product.
If a camera could deliver a useful view but isn't currently positioned for it, we'll flag that during setup so you can decide whether to reposition it.
## Related
- [What type of cameras do we need to have?](/knowledge/setup/installation/what-type-of-cameras-do-we-need-to-have)
- [How many cameras can be connected?](/knowledge/setup/installation/how-many-cameras-can-be-connected)
#### Can you add more cameras?
Aura Vision doesn't install new cameras — we connect to the cameras you already have. To change which existing cameras are connected, get in touch.
https://auravision.ai/knowledge/setup/installation/can-you-add-more-cameras
Aura Vision doesn't install new cameras — we connect to the cameras you already have. That's the whole point of the platform: existing CCTV becomes the analytics sensor.
## Adding coverage in an existing store
If a part of the store isn't currently being captured — a new product zone, a recently opened entrance, a refit — and one of your existing cameras has the right view, we can connect to that camera. Connectivity is a software change, not a hardware change.
## Adding cameras that don't exist yet
If the view you need isn't currently covered by any camera, you'll need to install the camera through your usual CCTV provider. Once it's on the store's camera network, we can connect to it. The APU (Analytics Processing Unit) handles up to nine cameras per device; larger setups use additional APUs.
To change which cameras are connected — or to scope an expansion — get in touch at [support@auravision.ai](mailto:support@auravision.ai).
## Related
- [What type of cameras do we need to have?](/knowledge/setup/installation/what-type-of-cameras-do-we-need-to-have)
- [How many cameras can be connected?](/knowledge/setup/installation/how-many-cameras-can-be-connected)
#### What type of cameras do we need to have?
We are compatible with 98% of the cameras on the market. Please see our camera recommendation guide and our APU datasheet.
https://auravision.ai/knowledge/setup/installation/what-type-of-cameras-do-we-need-to-have
We are compatible with 98% of the cameras on the market. Please see our [camera recommendation guide](https://docs.google.com/presentation/d/1ghxndI6TRs7vvgAi9mLw0dGD7gnRTSHMGr0LPoZ0bUw/edit?slide=id.g2a7ff9f2a28_0_63#slide=id.g2a7ff9f2a28_0_63) and our [APU datasheet](https://docs.google.com/document/d/1wkOJkdr5WiZOWE9N52wml90xy3NVQZ1KwS1k03A8qJY/edit?tab=t.0#heading=h.930tcvcpinin).
#### How does the APU connect to our cameras and internet?
The APU device connects to the camera switch/NVR/DVR in the store, and is connected to the internet network (if internet is not provided via the switch...
https://auravision.ai/knowledge/setup/installation/how-does-the-micro-pc-connect-to-our-cameras-and-internet
Please see our [APU datasheet](https://docs.google.com/document/d/1wkOJkdr5WiZOWE9N52wml90xy3NVQZ1KwS1k03A8qJY/edit?tab=t.0#heading=h.930tcvcpinin) and our [network connection chart](https://docs.google.com/presentation/d/1CyaR6YyXvQPi8zqzF0kD5Qt3iHQKH_BSEIaVfETyrPQ/edit?slide=id.gf5a843a8b1_0_1#slide=id.gf5a843a8b1_0_1) for enhanced information.
#### How is the APU internet and software secured?
All data is encrypted. No inbound connection is allowed into the device.
https://auravision.ai/knowledge/setup/installation/how-is-the-micro-pc-internet-and-software-secured
Please see our [ISMS security policies](https://docs.google.com/document/d/19C1Gyz-LDG3Mqjo5nPhrVLJXbXaF7PTD/edit) and our [data collection lifecycle documentation](https://docs.google.com/document/d/1_C2FMtbAAIO0kn3BVQ7DRsKflaAaeZnkeeELY_OR1QY/edit?tab=t.0) for further information.
#### Our internet is slow, will it still work?
We need a stable internet connection with the necessary bandwidth for the number of cameras you will be connecting to.
https://auravision.ai/knowledge/setup/installation/our-internet-is-slow-will-it-still-work
We do not upload RAW camera footage, and all processing takes place on the in-store APU.
We only transfer anonymised aggregated analytics over the internet. This keeps file upload sizes to a minimum.
#### What is the difference between the installations for Enhanced footfall and Full-store analytics set up?
For Enhanced Footfall we will connect to a single camera to capture entry counts and passer-by traffic counts.
https://auravision.ai/knowledge/setup/installation/difference-between-enhanced-footfall-and-full-store-analytics-installation
We connect to multiple in-store cameras for Full-store analytics.
The specification of the APU that connects to your CCTV hub will also vary slightly for each solution.
#### How can I track the progress of store installations?
Our Operations team will provide updates in the regular project calls during the installation period.
https://auravision.ai/knowledge/setup/installation/how-can-i-track-the-progress-of-store-installations
You can also check the status of each store in the Dashboard by selecting the Admin menu. This will show the list of active stores and those that are currently being set up.
#### What internal resources do we need during installation?
A successful installation typically needs three contacts on your side: an IT contact for camera access, a store-ops contact to define the areas to measure, and a project coordinator for rollout planning.
https://auravision.ai/knowledge/setup/installation/what-internal-resources-do-we-need-during-installation
A successful Aura Vision installation typically needs three contacts on your side, plus an early agreement on what good looks like.
## Before you begin
- Confirm the stores in scope and the timeline.
- Have a clear answer for "what are we trying to measure?" — this drives which cameras, areas and integrations matter.
## Who you'll need
1. **An IT contact.** Provides access to the camera network and the store's internet connection. Confirms firewall rules, VLAN setup and any change-management process the team needs to follow.
2. **A store-ops contact.** Helps define the product and service areas to measure (Footwear, Womenswear, Checkout, Fitting Rooms, Service Desk, etc.) and confirms what success looks like in operational terms.
3. **A project coordinator.** Owns the rollout plan across stores, schedules camera-access windows, and chases any internal blockers. For a single-store pilot the operations contact can wear this hat too.
## Defining the goals up front
Aura Vision's setup team will work with you to agree the goals you want to track — for example *"reduce conversion variance across stores"*, *"prove the ROI of a campaign within 8 weeks"*, *"shift labour spend by 12% without losing peak-hour coverage"*. Specific goals are easier to design the deployment around and easier to measure against.
## What we provide
- A named project lead from Aura Vision for the duration of the rollout.
- A setup engineer who handles the APU connection and AI tuning per store.
- A st…
#### Do you provide SSO (Single Sign-On) integration?
Yes — Aura Vision supports SSO via your existing identity provider (Okta, Azure AD / Entra ID, Google Workspace, OneLogin, JumpCloud and others).
https://auravision.ai/knowledge/setup/integrations/do-you-provide-sso-integration
Yes — Aura Vision supports Single Sign-On via your existing identity provider. SSO lets your team sign in to the Aura Vision dashboard with the same credentials they use for the rest of your enterprise stack.
## Supported identity providers
Aura Vision integrates with any SAML 2.0 or OIDC-compliant identity provider, including:
- Okta
- Microsoft Entra ID (formerly Azure AD)
- Google Workspace
- OneLogin
- JumpCloud
- Auth0
- LDAP-backed providers
## What SSO enables
- **Centralised access control** — provision and de-provision Aura Vision access through your IdP.
- **MFA inheritance** — multi-factor authentication policies you already enforce apply automatically.
- **Role-based permissions** — map IdP groups to Aura Vision roles (admin, analyst, store manager, viewer).
## Getting it set up
To enable SSO for your organisation, get in touch at [support@auravision.ai](mailto:support@auravision.ai). The team will arrange a short scoping call with your IT contact and provide the metadata exchange.
## Related
- [Can we integrate with your API?](/knowledge/setup/integrations/can-we-integrate-with-your-api)
- [Security at Aura Vision](/security)
#### Can we integrate with your API?
Yes — Aura Vision exposes a REST API for resources and a WebSocket API for metrics, both at 15-minute granularity. Use it to pull data into BI, data warehouses, internal apps or workforce-management tools.
https://auravision.ai/knowledge/setup/integrations/can-we-integrate-with-your-api
Yes — Aura Vision exposes a documented API for programmatic access to all the data shown in your dashboard.
## What's available
- **Core REST API** at `https://api.auravisionlabs.com/v1` — locations, recordings, campaigns, uptime, device status.
- **Metrics WebSocket API** at `wss://ws.auravision.ai` — footfall, dwell, occupancy, area utilisation, demographic breakdowns, transaction conversion, sales metrics, heatmaps, exports.
Both APIs support **15-minute granularity** down to per-quarter-hour records, plus hourly, daily, weekly and monthly aggregations.
## Common integration patterns
- **BI / data warehouse** — pull footfall, conversion and demographics into Snowflake, BigQuery, Looker, Power BI.
- **Workforce management** — feed customer-demand patterns into your scheduling tool.
- **Internal dashboards** — surface store-level KPIs in operational dashboards.
- **Custom apps** — power internal mobile apps with real-time occupancy and conversion.
## Documentation
Full API reference, authentication and endpoint catalogue: [/api](/api). To get an API key or scope an integration, get in touch at [support@auravision.ai](mailto:support@auravision.ai).
## Related
- [Do you ingest sales data?](/knowledge/analytics/conversion/do-you-ingest-sales-data)
- [Do you provide SSO integration?](/knowledge/setup/integrations/do-you-provide-sso-integration)
#### Can Aura Vision work with our existing workforce management systems?
We provide staffing optimisation insights that can inform your workforce management decisions.
https://auravision.ai/knowledge/setup/integrations/can-aura-vision-work-with-our-existing-workforce-management-systems
While we don't directly integrate with WFM systems, our data on customer demand patterns, queue analytics, and staff-customer interaction metrics can be exported to inform your scheduling tools and improve resource allocation.
#### Can I export the data?
There are multiple options for exporting the data to a CSV file including full demographic splits, hourly and weekday trends, and granularity ranging from 15...
https://auravision.ai/knowledge/setup/data-access/can-i-export-the-data
For a daily breakdown, the **_Key Metrics_** view provides multiple options for demographic splits, whilst the _Explorer_ view is the choice for 15-minute and hourly granularity in addition to trend analysis. A summary of export options, and an example of how to export, is included below.
## **Key Metrics:** Ideal for a daily breakdown — includes multiple options for demographic splits
Export Visible data
A summary of the total volumes for the selected date period
Export Visible data by day: split by role
A daily breakdown, split by staff and customer
Export Visible data by day: split by gender
A daily breakdown, split into male and female
Export Visible data by day: split by age
A daily breakdown, split into the seven age group categories
Export Visible data by day: split by age and gender
A comprehensive export including a daily breakdown by age and gender
Export Visible data by day: no split (excluding staff)
A daily breakdown with no demographic splits — staff are removed by default.
You can access these options at the bottom right of the Key Metrics view as shown in this image:
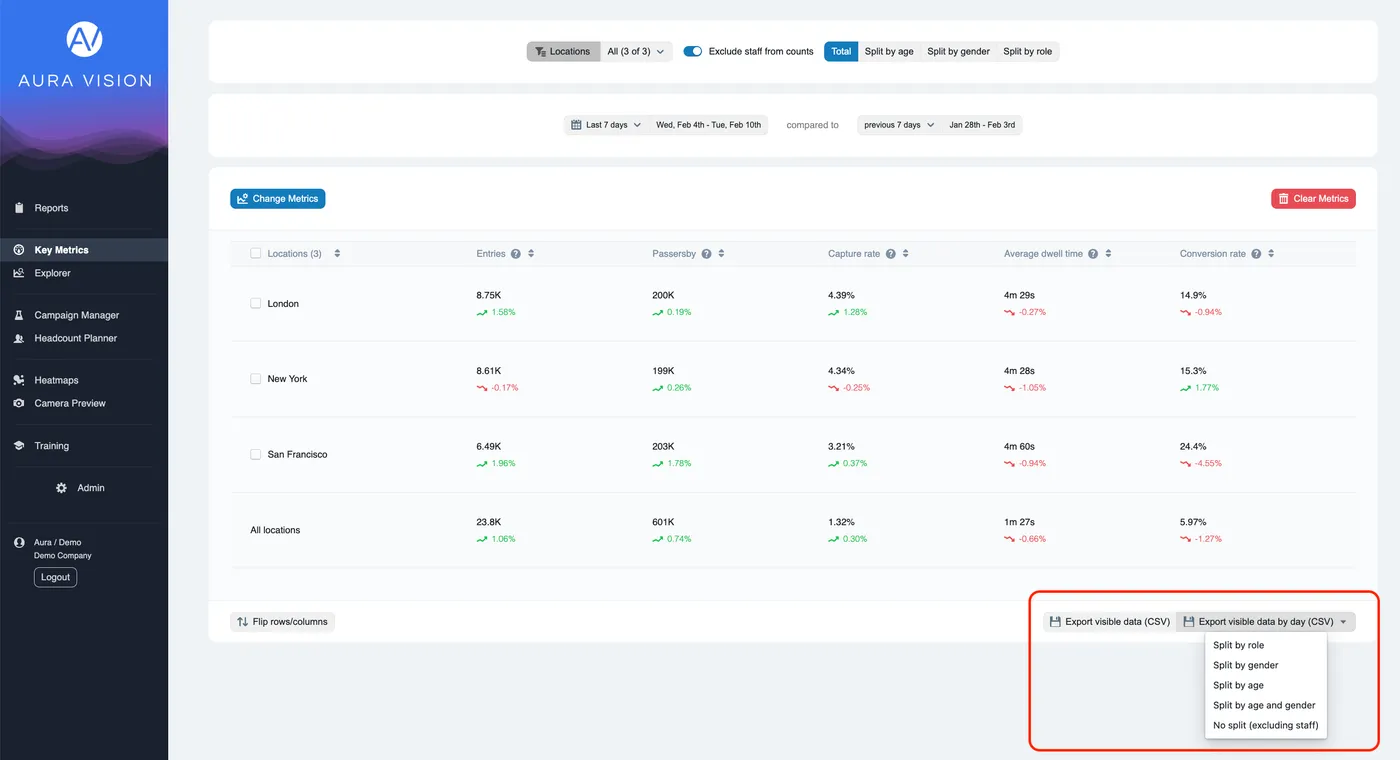
## **Explorer:** Ideal for 15-minute and hourly granularity, and trend analysis
Quarter hourly
Ideal for reviewing peak trade periods. A 15-minute breakdown
Hourly
Ideal for reviewing peak trade periods. An hourly breakdown
Daily
A daily breakdown
Weekly (Mon – Sun)
A weekly breakdown for organisations that requir…
#### How can I view my data in hourly and 15-minute granularity?
To view your data in hourly or 15-minute granularity, navigate to the Explorer view.
https://auravision.ai/knowledge/setup/data-access/how-can-i-view-my-data-in-hourly-and-15-minute-granularity
Once you have selected the metric(s) you wish to measure, select a single date from the date selector. 15-minute granularity works best when viewing a single day — a busy Saturday, for example.
Once you have selected the metrics and the stores that you wish to compare, click on the granularity selector (located at the top right of the graph). By default it is set to show daily data, but you can select from several options including hourly and quarter-hourly views.
You can export the data by simply clicking on the 'Export chart data (CSV)' button at the bottom left of the screen.
The video below walks you through the required steps.
#### How do I change the opening times for stores?
Admin users can edit store opening times directly from the dashboard. Changes apply to both future reporting and historical data — so a corrected opening time will re-shape past reports too.
https://auravision.ai/knowledge/setup/admin/how-do-i-change-the-opening-times-for-stores
Admin users can edit store opening times directly from the dashboard. Changes apply to both future reporting and historical data, so a corrected opening time will re-shape past reports too.
## Before you begin
You need an **Admin** role in the dashboard to edit opening times. If you don't have one, ask the person on your team who manages your Aura Vision user permissions to give you access — or contact [support@auravision.ai](mailto:support@auravision.ai) and we'll point you to the right person.
## Steps
1. Click **Admin**.
2. Click **Locations**.
3. Click the relevant location.
4. Click the **Edit Location** button in the top-right corner.
5. Click **Opening times**.
6. Update the opening times for each day and save.
## What you'll see
The store's reporting hours change immediately. Daily, weekly and monthly metrics recompute against the new opening times — including historical data, so prior reports for that store will reflect the corrected hours.
## Walkthrough video
## Related
- [What happens if a store closes, relocates or has a refit?](/knowledge/setup/admin/what-happens-if-a-store-closes-relocates-or-has-a-refit)
#### What happens if a store closes, relocates or has a refit?
Tell us as soon as the change is confirmed. For relocations we transfer the APU. For refits we re-map the areas against the new layout. For closures we arrange APU return. The earlier we know, the faster we can be live for the new trading period.
https://auravision.ai/knowledge/setup/admin/what-happens-if-a-store-closes-relocates-or-has-a-refit
Tell us as soon as the change is confirmed. The sooner we know, the faster we can be live for the new trading period.
## Relocations
We arrange the transfer of the APU (Analytics Processing Unit) from the old location to the new one, then run the full store setup process at the new site — camera mapping, AI tuning and the entry-count audit.
## Refits
If the layout, fixtures or displays change significantly, we re-map the store's areas against the updated floorplan. The APU itself stays in place; only the boundary configuration changes.
## Closures
We arrange the return of the APU and shut down reporting for the closed location.
## What to send us
To speed any of these up, include:
1. **The store name and address.**
2. **Opening and closing dates** — when the old layout ends and the new one starts.
3. **For relocations:** the new address.
4. **For refits or relocations:** the new floorplan with camera locations marked, and the area taxonomy you want (departments, zones, fitting rooms, checkout).
## When to contact us
Get in touch at [support@auravision.ai](mailto:support@auravision.ai) as soon as the change is confirmed — ideally 2–4 weeks before the new trading date so the setup audit lands in time.
## Related
- [How is Aura Vision installed?](/knowledge/getting-started/how-is-aura-vision-installed)
- [What happens if we move a camera?](/knowledge/setup/installation/what-happens-if-we-move-a-camera)
#### How to check camera and device connectivity
It is possible to check camera downtime by accessing the Admin menu in the dashboard. Here you will see a list of all locations and their connectivity status.
https://auravision.ai/knowledge/setup/troubleshooting/how-to-check-camera-and-device-connectivity
The video below shows you how to access this information:
#### How can I raise a support ticket?
Email support@auravision.ai. Standard support hours are 09:00–17:00 GMT, Monday to Friday.
https://auravision.ai/knowledge/setup/troubleshooting/how-can-i-raise-a-support-ticket
Get in touch at [support@auravision.ai](mailto:support@auravision.ai). Standard support hours are **09:00–17:00 GMT, Monday to Friday**.
## What's happening
Every email to that address creates a tracked ticket. You'll get a confirmation reply and a ticket reference; updates come back on the same thread.
## What to include
Including the right detail up front cuts resolution time in half:
- **Store name(s)** affected.
- **What you're seeing** — a screenshot of the dashboard view or a short description of the issue.
- **When it started** — date, time, whether it was triggered by a known change (refit, camera move, network change).
- **What's expected** — what the data should look like if you have a reference period.
## When to contact us
For dashboard or data-quality questions, urgent incidents, account changes, integration issues, or scoping a new use case.
#### How reliable is your dashboard and API?
We aim for 99.9% uptime of our dashboard and API - as defined in our MSA.
https://auravision.ai/knowledge/setup/troubleshooting/how-reliable-is-your-dashboard-and-api
You can check the status of our system here: [https://status.auravision.ai/](https://status.auravision.ai/)
#### What if I need to adjust the counts due to a disturbance in the store?
Email support@auravision.ai with the store, the affected dates, and a brief description of what happened. The team will review and correct the affected period if appropriate.
https://auravision.ai/knowledge/setup/troubleshooting/what-happens-if-i-need-to-adjust-the-counts
If something one-off has skewed your counts — a store event, a power-cut, a fire alarm, a film crew — get in touch at [support@auravision.ai](mailto:support@auravision.ai) with the store, the affected dates, and a brief description. The team will review and correct the affected period if appropriate.
## What's happening
Aura Vision's counts are deliberately not edited by store-side users — that keeps the data trustworthy across the business. When a genuine disturbance has affected a small window, the platform's support engineers can flag, annotate, or exclude that period from your reporting without affecting other stores or dates.
## What to do
1. Identify the store(s) and the affected time window (a specific day, hour range, or several days).
2. Email [support@auravision.ai](mailto:support@auravision.ai) with that information and a short description of what happened.
3. The team will assess, run an audit if needed, and confirm what correction they've made — usually within one business day.
## When to contact us
- A one-off in-store event (filming, evacuation, training day, photo shoot) artificially affected counts.
- A power cut or network outage caused data loss you can quantify.
- A till point or display was moved into a camera view temporarily.
#### How will I know if I’m losing data?
Our team monitor the uptime of all devices and registered cameras at your stores. When an issue is detected, we will attempt to resolve the issue remotely dur...
https://auravision.ai/knowledge/setup/troubleshooting/how-will-i-know-if-im-losing-data
If a device or camera goes offline, or if there's an issue with networking equipment, we will notify our point of contact within your organisation.
If a device loses internet connectivity but remains powered, it will cache data and re-upload up to 30 days of stored information once the connection is restored.
Our system automatically detects camera movements. We will check these to determine if your data is impacted, and we'll work with you to determine the best resolution.
It is also possible to check camera downtime by accessing the Admin menu in the dashboard. Here you will see a list of all locations and their connectivity status. The video below shows you how to access this information:
#### What happens if the Aura Vision device loses power?
The device will not be able to process video data into Analytics Data.
https://auravision.ai/knowledge/setup/troubleshooting/what-happens-if-the-device-loses-power
Analytics data will be lost if the device is powered down.
#### What happens if the Aura Vision device loses connection to the internet but not the cameras?
The device will continue to process video data into anonymous analytics and will cache data for up to 30 days.
https://auravision.ai/knowledge/setup/troubleshooting/what-happens-if-the-device-loses-internet-but-not-cameras
When the device resumes connection to the internet, it will upload up to 30 days of previously cached analytics data.
Data, reports and the API will all update retrospectively with the new data.
#### What happens if the Aura Vision device loses connection to the cameras?
The device will not be able to process video data into Analytics Data.
https://auravision.ai/knowledge/setup/troubleshooting/what-happens-if-the-device-loses-connection-to-the-cameras
Analytics Data will be lost if the cameras change IP, are disconnected from the network, or the power is disconnected.
If the device loses an internet connection but still has a connection to the cameras, the device will continue to process video data into anonymous analytics and will cache data for up to 30 days.
### Privacy & Security
#### Anonymous estimation
Anonymous estimation is the practice of classifying people into broad attribute groups — such as age band, gender or staff-versus-customer — rather than identifying individuals.
https://auravision.ai/knowledge/privacy/ai-privacy/anonymous-estimation
**Anonymous estimation** is the practice of classifying people into broad attribute groups — such as age band, gender or staff-versus-customer — rather than identifying individuals. The output is statistical, not biometric: a customer is placed into a category, never matched to a profile or stored identity.
## How it works
The AI infers attributes from body shape, gait, posture and clothing, not from faces (which are blurred at source). No face templates are generated, no biometric identifiers are computed, and no record links one visit to another. Every estimate is produced and aggregated locally on the APU, then released only as anonymous counts.
This is what makes the platform's outputs safe to share across the organisation: you can analyse who is visiting in aggregate, without ever processing personal data about who any specific visitor is.
## Related
- [Gender estimation](/knowledge/analytics/demographics/gender-estimation)
- [Age band](/knowledge/analytics/demographics/age-band)
- [Staff segmentation](/knowledge/analytics/demographics/staff-segmentation)
#### Encryption
Encryption is the protection of data in transit and at rest using industry-standard cryptographic protocols, applied to every byte of analytics that moves between the APU, the cloud and the dashboard.
https://auravision.ai/knowledge/privacy/security/encryption
**Encryption** is the protection of data in transit and at rest using industry-standard cryptographic protocols, applied to every byte of analytics that moves between the APU, the cloud and the dashboard. Aura Vision uses TLS for all network traffic and encrypts stored analytics at rest in its cloud platform.
## How it works
Because all video processing happens on the APU, no raw footage is ever transmitted. The only data that leaves the store is anonymous, aggregated analytics — visitor counts, dwell times, demographic breakdowns — encrypted over TLS as it travels to Aura Vision's cloud. Once received, that data is stored in encrypted form, with access governed by least-privilege role-based controls and SSO/MFA on customer accounts.
Encryption is one layer in a broader security posture that also includes privacy-by-design architecture, vetted vendors and an information-security management system aligned to ISO 27001.
## Related
- [Is the data secure and compliant with GDPR?](/knowledge/privacy/security/is-the-data-secure-and-compliant-with-gdpr)
- [What Information Security Standards do you follow?](/knowledge/privacy/security/what-information-security-standards-do-you-follow)
#### Computer vision
Computer vision in retail is the application of AI that enables computers to interpret and analyse visual information from cameras, allowing retailers to automatically understand customer behaviour, store operations, and in-store activity without manual observation.
https://auravision.ai/knowledge/privacy/ai-privacy/computer-vision
## What is computer vision in retail?
Computer vision is a branch of artificial intelligence that trains computers to interpret visual information — images and video — the way humans do. In retail, this means using cameras to automatically understand what's happening inside a store: how many people are visiting, where they go, how long they stay, and how they interact with products and displays.
Unlike traditional analytics that rely on point-of-sale data or manual surveys, computer vision provides a **continuous, objective view** of the entire customer experience from the moment someone walks through the door.
## Why it matters for retailers
Physical retailers face a fundamental data gap compared to their online counterparts. E-commerce platforms automatically track every click, scroll, hover, and purchase. Until recently, brick-and-mortar stores could only measure what happened at the till.
Computer vision closes this gap by providing the **in-store equivalent of web analytics**:
- **Visitor counting** — how many people entered, like unique visitors on a website
- **Path tracking** — how customers navigate the store, like clickstream analysis
- **Dwell analysis** — how long people spend in each area, like time-on-page
- **Conversion measurement** — what percentage of visitors actually bought, like checkout conversion rate
- **Demographic insights** — anonymous age and gender estimation of your audience
## How computer vision works in-store
### The technology stack
…
#### GDPR
GDPR is the General Data Protection Regulation — the UK GDPR and EU GDPR frameworks that govern how organisations process personal data about individuals in the UK and EU.
https://auravision.ai/knowledge/privacy/security/gdpr
**GDPR** is the General Data Protection Regulation — the UK GDPR and EU GDPR frameworks that govern how organisations process personal data about individuals in the UK and EU. It sets the standard for lawful basis, data minimisation, transparency, retention and the rights of data subjects.
## How it applies to Aura Vision
Because the platform produces only anonymous, aggregated counts and never identifies individuals, it processes no personal data within the meaning of GDPR. Faces are irreversibly blurred on the APU at the moment of capture, no biometric identifiers are stored, and no record links one visit to another.
This compliance position has been verified by an independent legal opinion from **Mishcon de Reya**, and the platform's privacy controls are aligned with both UK GDPR and EU GDPR. Customers operating regulated estates can sign Aura Vision's Data Processing Addendum as part of their contract.
## Related
- [Is the data secure and compliant with GDPR?](/knowledge/privacy/security/is-the-data-secure-and-compliant-with-gdpr)
- [What Information Security Standards do you follow?](/knowledge/privacy/security/what-information-security-standards-do-you-follow)
#### Face blurring
Face blurring is the irreversible process of obscuring faces on the APU at the moment of capture, before any image can leave the device.
https://auravision.ai/knowledge/privacy/ai-privacy/face-blurring
**Face blurring** is the irreversible process of obscuring faces on the APU at the moment of capture, before any image can leave the device. The blurring uses a one-way algorithm — the original face cannot be reconstructed from the blurred output, and the underlying raw frame is immediately discarded.
## How it works
Face detection and blurring run as the first stage of the on-device pipeline. By the time any frame is held for more than a few milliseconds, faces have already been anonymised. This applies both to operational processing and to the short snapshot windows used during per-store AI tuning, where blurred images are temporarily retained so the Computer Vision team can verify staff recognition and demographic accuracy.
Because blurring happens at source and cannot be reversed, the system produces no biometric identifiers, no face templates and nothing that could re-identify a customer.
## Related
- [Is de-blurring of the faces possible?](/knowledge/privacy/security/is-de-blurring-of-the-faces-possible)
- [Does it use facial recognition?](/knowledge/privacy/security/does-it-use-facial-recognition)
- [On-device processing](/knowledge/privacy/ai-privacy/on-device-processing)
#### ISO 27001
ISO 27001 is the international standard for information-security management systems (ISMS), specifying how an organisation should manage the confidentiality, integrity and availability of information.
https://auravision.ai/knowledge/privacy/security/iso-27001
**ISO 27001** is the international standard for information-security management systems (ISMS), specifying how an organisation should manage the confidentiality, integrity and availability of information. It defines controls for access management, change management, vendor risk, incident response, risk assessment and continual improvement.
## At Aura Vision
Aura Vision's policies and operational controls follow the ISO 27001 framework. A documented ISMS covers access control, change management, vendor management, incident response and risk assessment; all staff complete information-security training during onboarding and annually thereafter; and the platform is subject to annual external penetration testing.
Formal ISO 27001 certification audit is planned as part of the compliance roadmap. The ISMS itself is reviewed by leadership quarterly and updated whenever policies, suppliers or risk surface area change.
## Related
- [Are you ISO 27001 certified?](/knowledge/privacy/security/are-you-iso27001-certified)
- [What Information Security Standards do you follow?](/knowledge/privacy/security/what-information-security-standards-do-you-follow)
#### On-device processing
On-device processing is the architectural principle of running all AI inference locally on the in-store APU, so that raw video never leaves the building.
https://auravision.ai/knowledge/privacy/ai-privacy/on-device-processing
**On-device processing** is the architectural principle of running all AI inference locally on the in-store [APU](/knowledge/setup/installation/apu), so that raw video never leaves the building. It is the foundation of Aura Vision's privacy guarantee — because no footage is transmitted or stored centrally, there is no central pool of imagery that could be accessed, leaked or misused.
## How it works
Existing IP, RTSP or ONVIF cameras stream to the APU over the local store network. The APU runs the computer-vision models in real time: each frame is analysed in milliseconds and then discarded. Only the resulting anonymous, aggregated counts — visitor numbers, dwell times, demographic bands, queue metrics — are encrypted and sent to the cloud, at under 50 Kb/s per camera.
The result is that personal data is never produced in the first place. Privacy is a property of the architecture, not a policy bolted on afterwards.
## Related
- [APU](/knowledge/setup/installation/apu)
- [Face blurring](/knowledge/privacy/ai-privacy/face-blurring)
- [Anonymous estimation](/knowledge/privacy/ai-privacy/anonymous-estimation)
#### Is the data in real time?
Yes — Aura Vision ingests data live and reports it in 15-minute intervals on the dashboard, so trends and live occupancy are visible within minutes of the actual visit.
https://auravision.ai/knowledge/privacy/security/is-the-data-in-real-time
Yes — Aura Vision ingests data live and reports it on the dashboard in **15-minute intervals**, so trends and live occupancy are visible within minutes of the actual visit.
## How real-time the data is
- **Live occupancy** updates continuously and is visible on the dashboard as it changes.
- **Footfall, dwell, conversion and area metrics** appear in the dashboard at the end of each 15-minute interval.
- **Demographic splits** appear on the same 15-minute cadence.
## Why 15-minute intervals
The 15-minute granularity balances three things:
- **Detail** — granular enough to see opening-hour spikes, lunchtime peaks and end-of-day drop-offs in shift-relevant time windows.
- **Stability** — long enough to avoid statistical noise from short-burst variations.
- **Usable cadence** — every operational decision a store manager makes lives on a 15-minute or longer horizon (schedules, queue staffing, restocking).
If you need a tighter granularity for a specific use case — for example sub-minute occupancy for a live event — get in touch at [support@auravision.ai](mailto:support@auravision.ai).
## Related
- [How reliable is your dashboard and API?](/knowledge/setup/troubleshooting/how-reliable-is-your-dashboard-and-api)
- [Can we integrate with your API?](/knowledge/setup/integrations/can-we-integrate-with-your-api)
#### Is the data secure and compliant with GDPR?
Yes. Please refer to our privacy by design document for more information.
https://auravision.ai/knowledge/privacy/security/is-the-data-secure-and-compliant-with-gdpr
Yes. Please refer to our [privacy by design document](https://docs.google.com/document/d/1C8vKUCLpjD6wTHDhlxavf6OOIhSMQagVdXyK4BmW3Aw/edit?usp=sharing) for more information.
#### How long is historical data retained?
We retain the analytics data for the duration of the contract, and this includes 15-minute granularity across all metrics.
https://auravision.ai/knowledge/privacy/security/how-long-is-historical-data-retained
This data is deleted 30 days after the contract termination.
Anonymised image training data is stored for a maximum of two weeks.
Audit videos (blurred footage) are retained for up to four weeks.
#### What Information Security Standards do you follow?
Aura Vision's Information Security Management System is built around ISO 27001 principles, with privacy controls aligned to UK GDPR and EU GDPR (verified by Mishcon de Reya) and operational practices that match SOC 2-style controls.
https://auravision.ai/knowledge/privacy/security/what-information-security-standards-do-you-follow
Aura Vision's Information Security Management System (ISMS) is built around the **ISO 27001** framework. Privacy controls are aligned to **UK GDPR and EU GDPR** (verified by a legal opinion from Mishcon de Reya) and our operational practices match the controls expected of SOC 2-style audits.
## What this covers
- **Information security policy** — documented and reviewed quarterly by leadership.
- **Access control** — least-privilege role-based access to all systems; SSO and MFA available for customer accounts.
- **Change management** — every code change reviewed and tested before deployment.
- **Vendor risk** — all third-party services assessed and contracted with appropriate data-processing terms.
- **Incident response** — documented procedures, on-call rota, and customer notification commitments.
- **Penetration testing** — annual external testing by an independent provider.
## How it works
Information security isn't a separate workstream — it's built into how the platform is designed (privacy by design) and how the team operates (security by default). All staff complete information-security training as part of onboarding and annually after.
## Where to read more
- [Security at Aura Vision](/security) — architecture, encryption, access control
- [Product privacy](/product-privacy) — privacy by design
- [Data Processing Addendum](/data-processing-addendum) — formal DPA
- [Are you ISO 27001 certified?](/knowledge/privacy/security/are-you-iso27001-certified)
#### Are you ISO 27001 certified?
Aura Vision follows ISO 27001 procedures and principles across development, operations and information security management. Formal certification is on our roadmap.
https://auravision.ai/knowledge/privacy/security/are-you-iso27001-certified
Aura Vision follows ISO 27001 procedures and principles across development, operations and information security management. Formal certification is on our roadmap.
## What this means in practice
- A documented Information Security Management System (ISMS) covers access control, change management, vendor management, incident response and risk assessment.
- Annual penetration testing and a coordinated vulnerability-disclosure programme.
- All staff complete information-security training as part of onboarding and annually thereafter.
- Privacy-by-design controls — face blurring at source, on-device processing, no video stored — are independently described in our product privacy page.
## How it works
Our ISMS is reviewed by Aura Vision's leadership quarterly and updated when policies, suppliers or risk surface area change. Formal ISO 27001 certification audit is planned as part of our compliance roadmap.
## Where to read more
- [Security at Aura Vision](/security) — full architecture
- [Product privacy](/product-privacy) — privacy by design
- [What Information Security Standards do you follow?](/knowledge/privacy/security/what-information-security-standards-do-you-follow)
#### Does Aura Vision store the CCTV footage?
We never store or recall raw CCTV footage.
https://auravision.ai/knowledge/privacy/security/does-aura-vision-store-the-cctv-footage
Audit videos include heavily blurred images so no individuals can be identified.
Audit videos are retained for a period of four weeks.
#### Who has access to the anonymised audit videos?
Only authorised Aura Vision operations team members with explicit permission and relevant training have access to the resources.
https://auravision.ai/knowledge/privacy/security/who-has-access-to-the-anonymised-audit-videos
During the labelling process, trained Aura Vision staff members have short-lived access to specific and completely anonymised images only.
#### Is de-blurring of the faces possible?
No, de-blurring is not possible. All processed footage is irreversibly blurred using one-way processing, and the original raw footage is immediately deleted.
https://auravision.ai/knowledge/privacy/security/is-de-blurring-of-the-faces-possible
The blurring process cannot be reversed, ensuring permanent anonymisation.
#### Does it use facial recognition?
No. Aura Vision never identifies individuals and never stores biometric data. Faces are blurred at source on the APU before any image leaves the device.
https://auravision.ai/knowledge/privacy/security/does-it-use-facial-recognition
No. Aura Vision never identifies individuals and never stores biometric data. Faces are blurred at source on the APU (Analytics Processing Unit) before any image leaves the device.
## What this means in practice
- **No identity.** The system can tell you how many people visited an area; it cannot tell you who they were.
- **No biometric storage.** No face templates, fingerprints, or other biometric identifiers are computed or stored.
- **Anonymous demographic estimation only.** Age and gender estimates are statistical — a customer is classified into a band, not matched to a profile.
- **Irreversible blurring.** Faces are obscured by an irreversible process before any image is used for AI tuning. The original face cannot be recovered.
## How it works
All video is processed locally on the APU using computer vision. Anonymous, aggregated counts are sent to the cloud for reporting; the underlying video is discarded immediately and never stored.
## Where to read more
- [Product privacy](/product-privacy) — privacy by design
- [Security at Aura Vision](/security) — full architecture
- [How do you train your AI?](/knowledge/privacy/ai-privacy/how-do-you-train-your-ai)
- [Is de-blurring of the faces possible?](/knowledge/privacy/security/is-de-blurring-of-the-faces-possible)
#### How do you train your AI?
Aura Vision fine-tunes its AI to each store using a small set of face-blurred snapshot images during the first week of operation, then continuously improves through quarterly accuracy audits. No personal data is ever used.
https://auravision.ai/knowledge/privacy/ai-privacy/how-do-you-train-your-ai
Aura Vision fine-tunes its AI to each store using a small set of face-blurred snapshot images during the first week of operation, then continuously improves through quarterly accuracy audits. No personal data is ever used.
## What this means in practice
- **No facial recognition.** Faces are blurred at source on the APU before any image leaves the device. The blurring is irreversible — the original face cannot be recovered.
- **No personal data.** A blurred snapshot doesn't identify the person. Locations and timestamps of snapshots are not stored.
- **Snapshots are deleted.** Training data is held only briefly during the tuning window, then discarded.
- **Tuning is per-store.** The AI is adapted to your store's lighting, camera angles, staff uniforms and customer demographics — so accuracy is high from day one rather than relying on a generic model.
## How it works
The Computer Vision team uses the blurred snapshots to refine three things for your store: people counting accuracy, age and gender estimation accuracy, and staff-vs-customer recognition (matching your team's uniform). Once tuned, the model runs entirely on the on-premise APU — only anonymous, aggregated analytics ever reach the cloud.
The same audit-and-tune loop runs quarterly on a randomised sample of stores to maintain accuracy as cameras, layouts and uniforms change.
## Where to read more
- [Product privacy](/product-privacy) — privacy by design
- [Security at Aura Vision](/security) — full architecture…
## Case Studies
### Virgin Media O2 — 22X ROI from optimizing display engagement · 307 Stores rolled out across the UK
Virgin Media O2 chose Aura Vision as its preferred analytics supplier — optimising handset display engagement for a 22X return on investment and deploying full-store analytics across all 307 retail locations nationwide.
https://auravision.ai/case-studies/virgin-media-o2-x-aura-vision-full-scale-roll-out
### Adidas UAE — 33% More engagement with product displays · 15% Improved staff allocation · 9X Return on investment
Discover how Adidas UAE turned its existing CCTV into a powerful analytics engine — sharpening staffing, boosting product engagement, and delivering a 9X return on investment.
https://auravision.ai/case-studies/adidas-dubai-x-aura-vision
### Decathlon — 0.5% Conversion Uplift · 6X ROI
Decathlon deployed Aura Vision as a plug-and-play pilot across multiple stores — tracking segment performance, benchmarking refits, and delivering a 0.5% conversion uplift and 6X return on investment in just weeks.
https://auravision.ai/case-studies/secrets-of-store-success-exploring-decathlon
### Flannels — 1.5% Conversion uplift · 34% Improvement in staff-customer allocation · 8X ROI
Flannels rolled out Aura Vision across all 50+ UK stores — using Precision Staff Planning to boost conversion by 1.5%, improve staffing allocation by 34%, and deliver 8X ROI from a single use case.
https://auravision.ai/case-studies/flannels-x-aura-vision
### Purple — 24% More accurate than the previous traditional footfall counter · 5X ROI
Purple deployed Aura Vision across all 78 US showrooms — delivering 24% more accurate customer counts than the previous traditional footfall counter with automatic staff segmentation, tracking exactly which mattresses attract the most engagement, and delivering a 5X return on investment.
https://auravision.ai/case-studies/purple-x-aura-vision
### Gymshark — 5X Utilisation of key in-store zones · 63% Increase in changing room entries · 10% Increase in capture rates for target demographics
Gymshark used Aura Vision to redesign its Regent Street flagship — lifting changing room usage by 63%, increasing key zone engagement by 5X, and building the playbook for every store that followed.
https://auravision.ai/case-studies/gymshark-x-aura-vision
### Krys Group — €1.1M Revenue uplift opportunity uncovered
Krys Group deployed Aura Vision across three pilot stores to understand queue behaviour, service-desk utilisation, and customer demographics — uncovering a €1.1M revenue uplift opportunity and a replicable blueprint for 1,600 locations.
https://auravision.ai/case-studies/krys-group-x-aura-vision
### A.S. Watson (Kruidvat) — 4X ROI annually · 8% More accurate footfall counting
Kruidvat partnered with Aura Vision to go beyond basic footfall counters — automatically segmenting staff from customers for 8% more accurate counts, optimising checkout layouts, and delivering a 4X annual return on investment.
https://auravision.ai/case-studies/a-s-watson-kruidvat-x-aura-vision
### Onitsuka Tiger — 5X ROI
Onitsuka Tiger harnessed its existing CCTV to measure every zone in its London flagship — giving trading, marketing, and store teams the data to optimise layouts, staffing, and visual merchandising for a 5X return on investment.
https://auravision.ai/case-studies/onitsuka-tiger-case-study
### Bedford City Council — 22M+ Visitors counted each year
Bedford City Council connected Aura Vision to existing town-centre CCTV — counting over 22 million visitors a year, segmenting by age and gender, and using the insights to validate multi-million-pound infrastructure investments.
https://auravision.ai/case-studies/bedford-city-council-x-aura-vision
### Schuh — £9.9m Annual revenue attributed to correct digital PoS placement
Schuh used Aura Vision's demographic A/B testing to pinpoint optimal digital point-of-sale placement — attributing £9.9M in annual revenue to getting screen positioning right.
https://auravision.ai/case-studies/schuh-x-aura-vision
### Centrepoint — 4X ROI · $955K Saved in lost revenue · $1.8M Sales opportunity
Centrepoint used Aura Vision's Basket Recovery tools to monitor queue times and transaction speeds across staffed and self-service checkouts — saving $955K in lost revenue, surfacing a $1.8M sales opportunity, and delivering 4X ROI.
https://auravision.ai/case-studies/centrepoint-x-aura-vision
### Situ Live
Situ Live used Aura Vision to turn its experiential Westfield destination into a measurable brand platform — tracking demographics, optimising staff coverage, and giving brand partners quantifiable engagement data for the first time.
https://auravision.ai/case-studies/situ-live-x-aura-vision
### Neighborhood Goods — 30% More accurate conversion rate & customer counts · 45% Better store utilisation of areas & departments
Neighborhood Goods replaced unreliable footfall sensors with Aura Vision across all three US locations — delivering 30% more accurate customer counts, 45% better store utilisation, and zone-level engagement reports that turned the retailer into an insights platform for its brand partners.
https://auravision.ai/case-studies/neighborhood-goods-x-aura-vision
### DFS — £2M Revenue Uplift · 12% Increased Dwell Time · 24% More Accurate Counts
DFS used heatmaps and demographic insights to move high-engagement products away from the entrance — increasing dwell time by 12%, improving customer flow, and uncovering a £2M revenue opportunity.
https://auravision.ai/case-studies/dfs-x-aura-vision
### c2c — 99% Counting Accuracy
c2c used Aura Vision's AI-powered footfall analytics on existing station CCTV to count passengers through open barriers with 99% accuracy — reclaiming lost ticket revenue without disrupting a single journey.
https://auravision.ai/case-studies/c2c-x-aura-vision
## Industries Served
- Retail (fashion, footwear, electronics, grocery, home furnishings, beauty, sport)
- Shopping centres and malls
- Transport hubs (train stations)
- Public spaces and high streets
- Experiential retail
## Contact
- Website: https://auravision.ai/contact
- General enquiries via the website contact form
- LinkedIn: https://www.linkedin.com/company/auravisionlabs
## Site Pages
- Home: https://auravision.ai/
- About: https://auravision.ai/about
- API Documentation: https://auravision.ai/api
- Blog: https://auravision.ai/blog
- Case Studies: https://auravision.ai/case-studies
- Contact: https://auravision.ai/contact
- Data Processing Addendum: https://auravision.ai/data-processing-addendum
- Knowledge: https://auravision.ai/knowledge
- Performance Wheel: https://auravision.ai/performance-wheel
- Press: https://auravision.ai/press
- Privacy Policy: https://auravision.ai/privacy
- Product Privacy: https://auravision.ai/product-privacy
- Security: https://auravision.ai/security
- LinkedIn: https://www.linkedin.com/company/auravisionlabs